
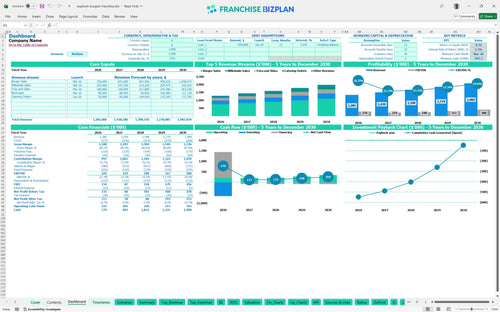
All-in-one Dashboard
Core inputs and core outputs


This comprehensive Excel template for franchise unit financial projections provides a detailed roadmap for revenue, expenses, and capital needs to ensure your investment is sound.
Core inputs and core outputs
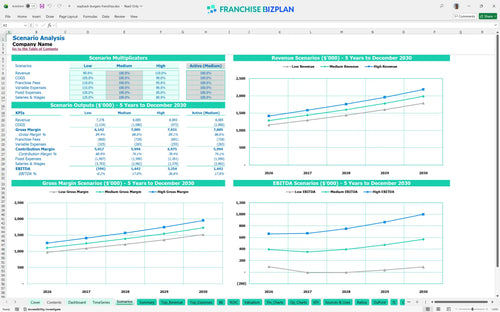
Three scenario analysis
Presentation ready
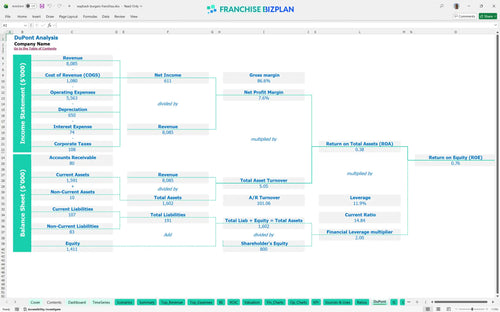
DuPont analysis
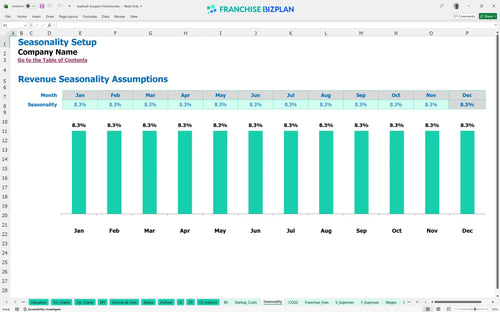
Researched revenue assumptions
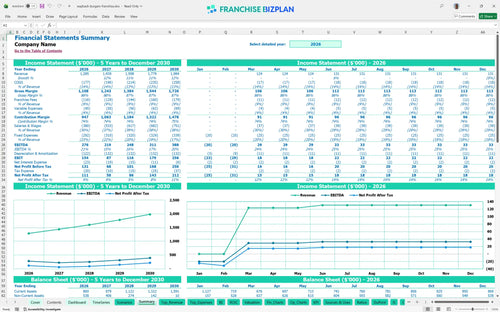
Lender-friendly financial outputs
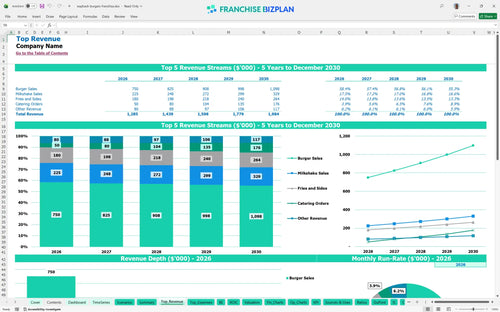
Revenue stream detailed view
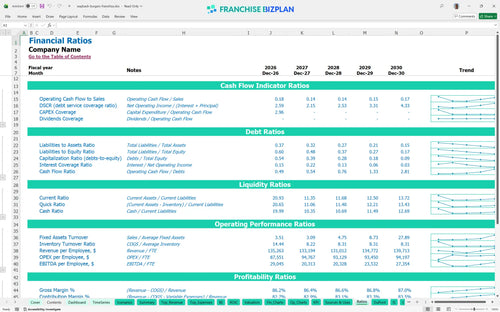
Performance metrics benchmark
We built this franchise unit profitability model using deep research into the fast-casual burger sector to give you a head start. Key assumptions like the $1.28M year-one revenue and 9% combined royalty/marketing fees are pre-populated but defintely editable to fit your specific market. This franchise business model financial analysis tool is designed to show how $18,000 monthly rent and high-volume express windows impact your actual take-home pay.
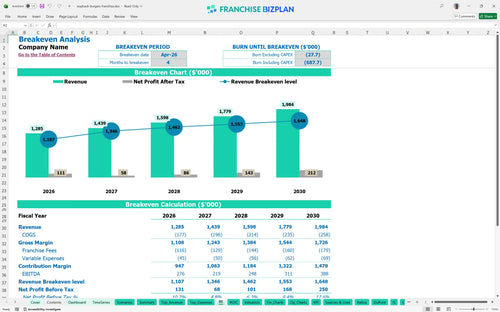
Preparing a financial feasibility study for a franchise unit shows a positive EBITDA of $276,000 in the first year. While the unit is profitable from the start, the model accounts for a dip to $219,000 in year two as you scale assistant management and event staff to handle growth. Profitability is about more than just sales; it is about managing the 12% food cost as volume increases.
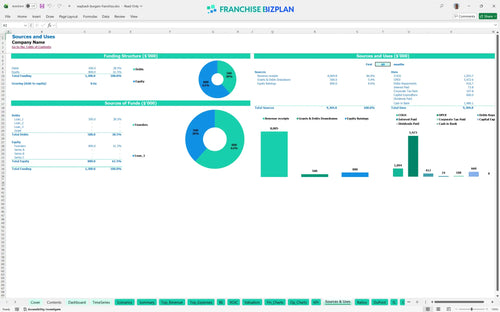
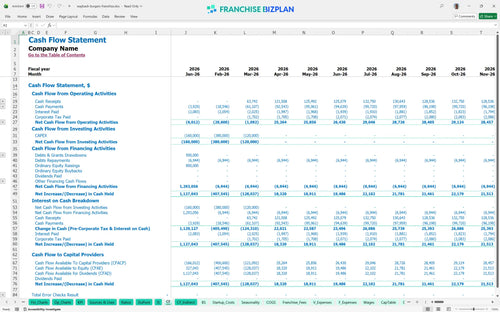
You need approximately $660,000 in total capital to cover the initial franchise fee and the heavy build-out costs required for this concept. This includes $250,000 for leasehold improvements and $230,000 for specialized kitchen, refrigeration, and shake equipment to handle the 'fresh' brand standard. Your opening cash buffer is critical since the lowest cash point hits $591,000 in the first few months.
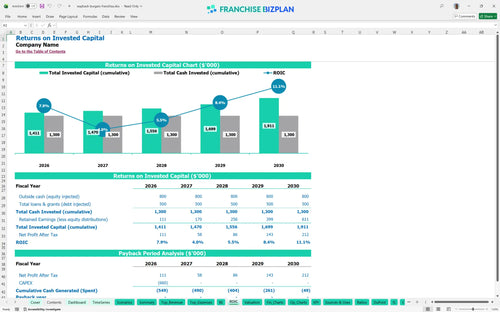
Calculating return on investment for a new franchise unit shows an IRR of 2.28% over the five-year horizon with a return on equity of 0.76. While the store-level EBITDA is strong, the high initial build-out costs mean full payback occurs just after the five-year mark. Still, by year five, the unit is generating $388,000 in annual EBITDA, making it a valuable long-term asset.
This restaurant franchise revenue forecasting model shows the unit reaches its monthly break-even point in April 2026, just four months after opening. The biggest driver here is the $18,000 monthly rent; you need consistent daily traffic and a strong average ticket to cover these high fixed occupancy costs. If opening takes 90+ days longer than planned, the pressure on your working capital will rise quickly.
Your lowest cash point is $591,000 in March 2026, right as operations begin and the final equipment payments clear. You will need a solid runway to handle the pre-opening months where rent, insurance, and $75,000 manager salaries are due but the grills aren't yet hot. Maintaining a cash buffer is essential to survive the initial ramp-up phase before catering revenue kicks in.
This financial template for multi-channel restaurant operations allows you to compare how a 10% drop in traffic impacts your ability to pay that $18,000 rent. In the high case, aggressive local marketing and catering growth can push year-5 revenue toward $2M, significantly improving your IRR. But in a low scenario, the 9% royalty and marketing burden makes the margin very thin, potentially delaying payback by another year.
Finance: update unit break-even and payback model by Friday
This franchise financial model template is built in Excel, allowing you to tweak every variable from burger prices to hourly wages. Since every territory has different labor laws and rent hikes, having editable assumptions means you can stress-test your specific market before signing a lease. It is a flexible fast casual restaurant business plan tool that handles the heavy lifting of math so you can focus on the strategy. Every 1-point margin leak matters fast in a single-unit model.

Long-term planning is about more than just year one; you need to see how scaling catering or adding an express window impacts the bottom line over time. This model provides a full five-year view of your P&L, balance sheet, and cash flow to help with capital expenditure forecasting. Honestly, seeing the projected jump from $1,285,000 to $1,984,000 in annual sales helps you plan for equipment replacements and staff raises well in advance. This fast casual restaurant financial planning spreadsheet keeps your growth targets realistic.

Managing a brand means paying for the name, and this model tracks those 5% royalty fees and 4% marketing fund contributions with precision. Analyzing franchise royalty and marketing fund costs is vital because these 'off-the-top' expenses eat into your store-level margin every single month. By baking these into your monthly projections, you get a realistic look at what is left for the owner after the franchisor gets their cut. Your franchise profit margin depends heavily on managing these fixed brand obligations alongside local overhead.

Knowing how to calculate startup costs for a burger franchise is the first step to avoiding a cash crunch during the build-out. This model aggregates your $250,000 leasehold improvements and $150,000 kitchen package to show your total 'all-in' number before the first burger is flipped. The break-even analysis then tells you exactly how much revenue you need to generate each month to cover your $18,000 rent and labor. Use this franchise investment calculator to see exactly where your safety margin lies.

Don't fly blind; use the built-in benchmarks to see if your 12% food cost or $18,000 rent is in line with other fast-casual operators. This restaurant startup cost template helps you sanity-check your numbers against industry standards for labor and occupancy. If your projections are way off the norm, it is a signal to dive deeper into your site selection or staffing plan. Estimating monthly operating expenses for a franchise becomes much simpler when you have a baseline to compare against.


Simply purchase and download the financial model template, then access it instantly using Microsoft Excel or Google Sheets. No installation or technical expertise required-just open and start working.

Enter your business-specific numbers, including revenue projections, costs, and investment details. The pre-built formulas will automatically calculate financial insights, saving you time and effort.

Leverage the investor-ready format to confidently showcase your financial projections to banks, franchise representatives, or investors. Impress stakeholders with clear, data-driven insights and professional reports.

Leverage the investor-ready format to confidently present your projections to banks, franchise representatives, or investors.