
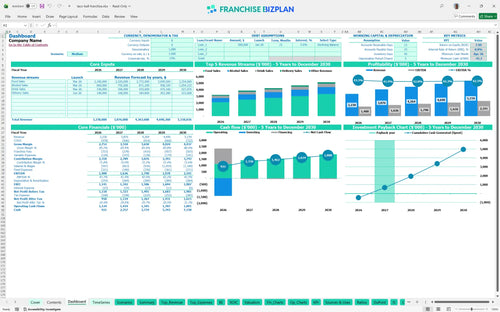
All-in-one Dashboard
Core inputs and core outputs


This comprehensive Excel template provides a complete toolkit for estimating operating costs for urban franchise locations and projecting multi-year returns.
Core inputs and core outputs
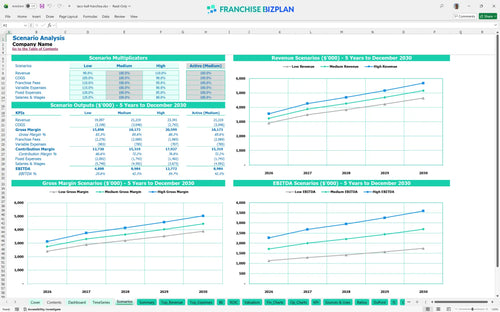
Three scenario analysis
Presentation ready
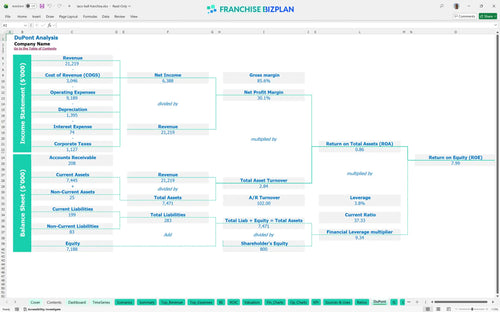
DuPont analysis
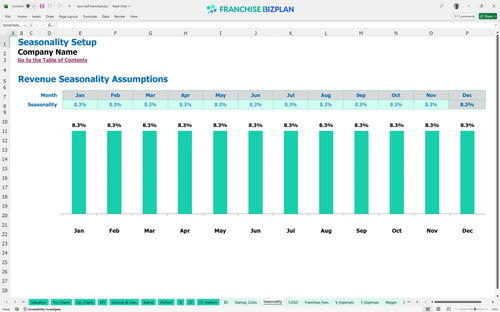
Researched revenue assumptions
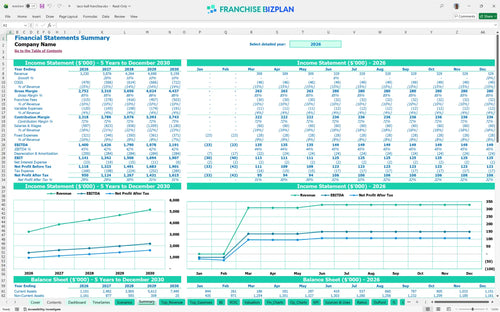
Lender-friendly financial outputs
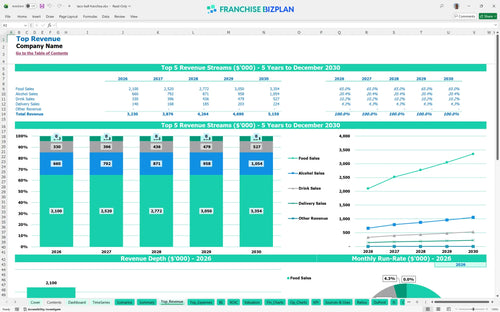
Revenue stream detailed view
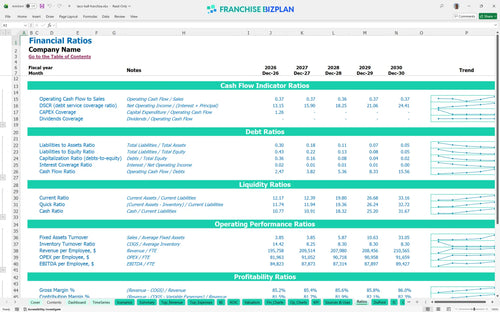
Performance metrics benchmark
We built this franchise unit financial model using our own research on this specific Cantina-style QSR concept. Key assumptions like the $3.23 million year-one revenue and 5.5% royalty fees are pre-populated and fully editable. You can easily adjust the $1.42 million total investment or staffing levels to fit your specific Austin West Campus site.
This unit hits its break-even date in March 2026, just three months after launching. With a year-one EBITDA of $1.4 million, the model shows a fast ramp-up as delivery and alcohol sales supplement the core menu. Speed to profit is the ultimate QSR metric.
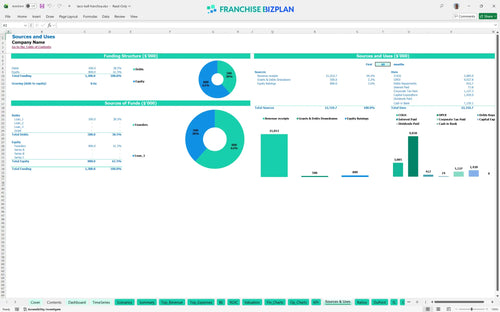
You need approximately $1.42 million to get this unit off the ground in the US. This covers the $45,000 initial fee and heavy leasehold improvements for the Cantina lounge. The model also accounts for a $42,000 minimum cash need during the early ramp-up phase. Capital allocation determines your opening strength.
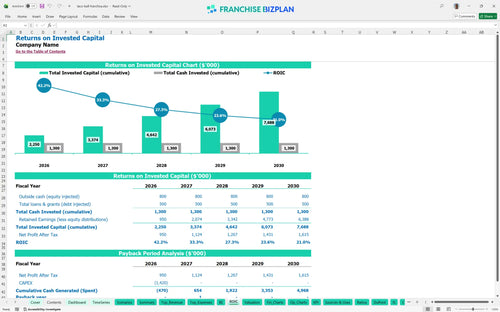
Investors can expect an Internal Rate of Return (IRR) of 8% and a Return on Equity (ROE) of 7.99%. The payback period is remarkably short at just 2 years, thanks to high volume in the West Campus district. Two years to get your money back is a strong win.
Monthly break-even occurs just 3 months in, driven by high foot traffic and a $20,000 monthly rent obligation. The biggest lever for reaching this point is volume; the model assumes food sales hit $1.4 million in the first year. Volume solves almost every operational headache.
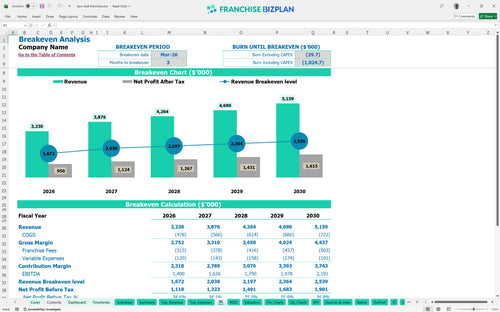
The lowest cash point hits in April 2026 at negative $42,000, meaning you need a small working capital buffer beyond the initial CAPEX. This temporary dip happens right as the delivery hub and alcohol service scale up. Cash is your only real safety net during ramp-up.
Moving from a Medium to a High scenario significantly boosts the 8% IRR by leveraging the fixed $20,000 rent against higher sales. In the Low case, year-one margins tighten as the 9.75% combined royalty and marketing fees eat a larger share of revenue. Scenarios prepare you for the best and worst days.
Finance: update unit break-even and payback model by Friday.
This franchise unit financial model template is built in Excel to give you total control over your numbers. You can adjust pre-filled formulas and editable assumptions to match your specific urban territory or suburban site. It defintely simplifies the process of stress-testing different operating scenarios before you sign a lease. Every cell is open for your input.

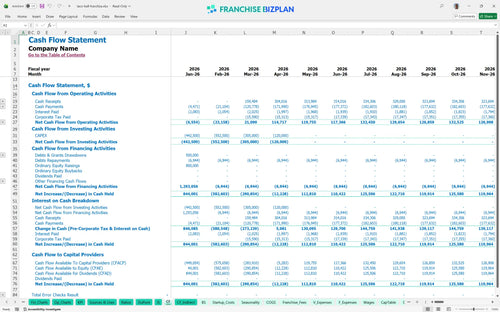
Planning for the long term is vital when scaling a QSR franchise business plan. This model provides a clear view of your five-year revenue, which climbs from $3.23 million in year one to over $5.1 million by year five. You get a full look at the balance sheet and cash flow to ensure your growth stays on track. Five years of data keeps your exit strategy in sight.

Managing ongoing obligations is a core part of franchise unit profitability analysis. This tool tracks the 5.5% royalty and 4.25% marketing fund contributions against your gross sales. By automating these calculations, you see exactly how much cash stays in the unit after the franchisor takes their cut. Royalties are a fixed reality of the system.

Use this restaurant startup cost calculator to map out your initial $1.42 million investment. It covers everything from the $45,000 franchise fee to the $750,000 leasehold improvements. The model then identifies the exact sales volume needed to cover your $20,000 monthly rent and other fixed overhead. Know your number before you sign the lease.

We integrated unit economics benchmarks to help you sanity-check your fast food franchise financial projection. If your food ingredients cost exceeds the 13% target or your labor ratios drift, the model flags it. This ensures your business case for a franchise investment is grounded in real-world QSR performance standards. Benchmarks keep your projections honest.


Simply purchase and download the financial model template, then access it instantly using Microsoft Excel or Google Sheets. No installation or technical expertise required-just open and start working.

Enter your business-specific numbers, including revenue projections, costs, and investment details. The pre-built formulas will automatically calculate financial insights, saving you time and effort.

Leverage the investor-ready format to confidently showcase your financial projections to banks, franchise representatives, or investors. Impress stakeholders with clear, data-driven insights and professional reports.

Leverage the investor-ready format to confidently present your projections to banks, franchise representatives, or investors.