


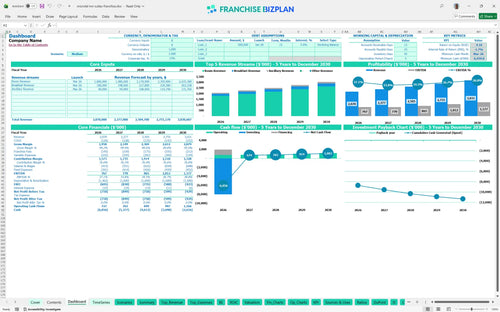
All-in-one Dashboard
Core inputs and core outputs



This franchise financial projection spreadsheet includes everything from a capital expenditure budget to detailed P&L statements for a new hospitality unit.
Core inputs and core outputs
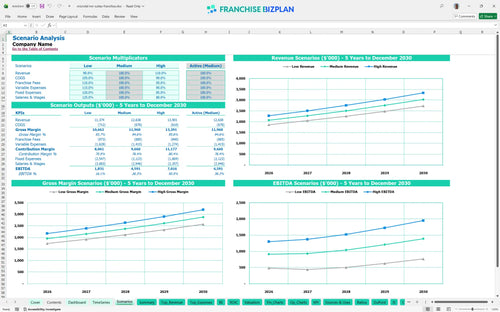
Three scenario analysis
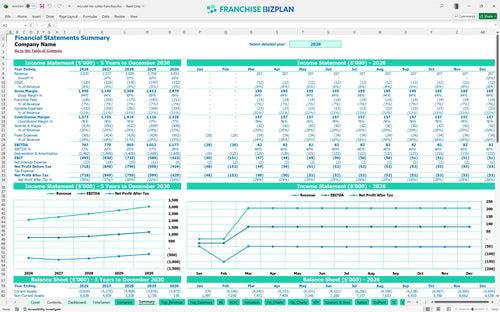
Presentation ready
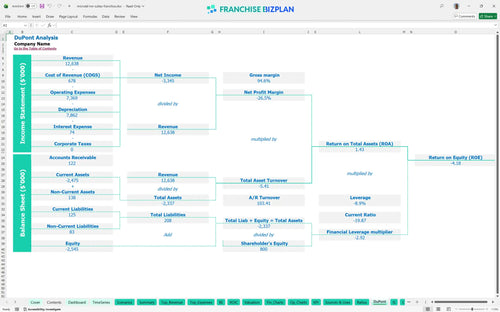
DuPont analysis
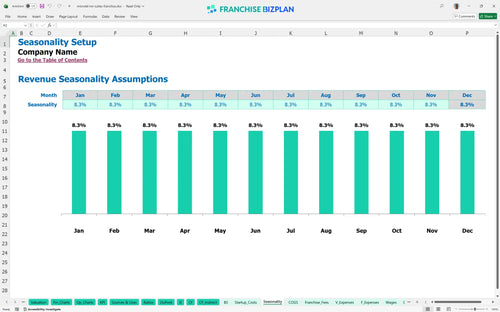
Researched revenue assumptions
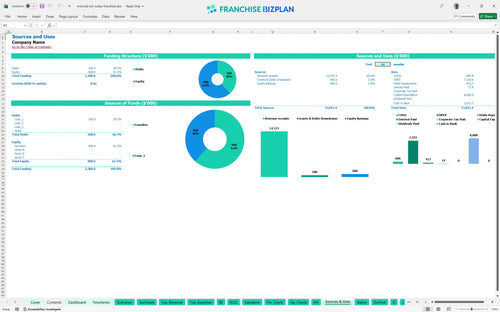
Lender-friendly financial outputs
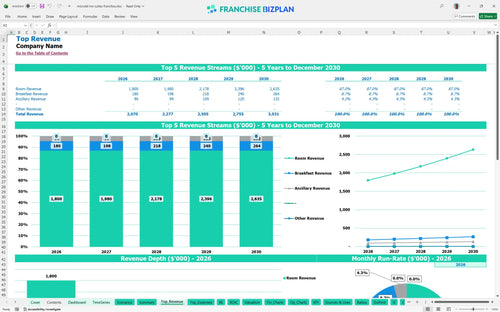
Revenue stream detailed view
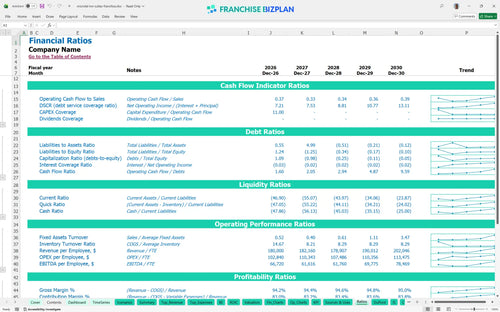
Performance metrics benchmark
We built this franchise unit financial model based on deep research into economy hotel operations and brand standards. The pre-populated data covers everything from the $4.8M construction cost to the $40,000 initial fee, giving you a realistic starting point that you can edit as your site selection and local demand become clearer. With Year 1 EBITDA (Earnings Before Interest, Taxes, Depreciation, and Amortization) projected at $767,000, the model shows the potential of a well-run unit in a high-demand corridor.
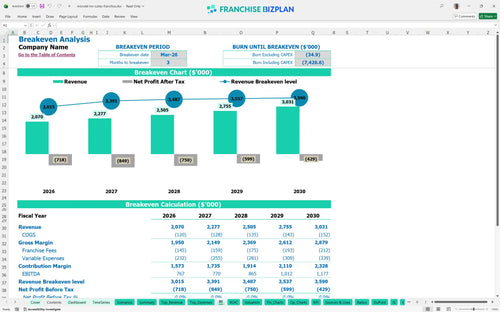
This franchise unit hits operational break-even in March 2026, just three months after opening its doors. While Year 1 EBITDA is a healthy $767,000, full net profitability after all debt service and depreciation takes longer due to the $8.1M startup cost, so you are playing a long-term equity game.
You need approximately $8.1M in total capital to launch this unit, with the bulk of funds allocated to building construction and furniture. This hotel franchise startup costs analysis includes $4.8M for the building and $1M for furniture, fixtures, and equipment to meet brand standards.
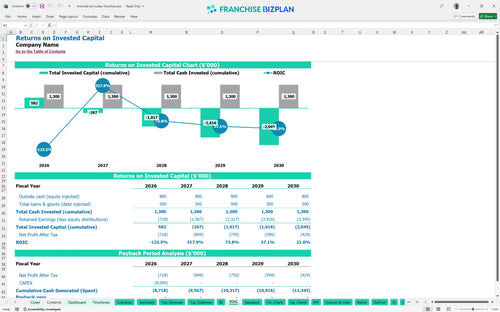
The model projects an IRR (Internal Rate of Return) of -1.67% over the first five years, with a full payback occurring after the five-year mark. To be fair, this is typical for a heavy capital expenditure budget in real estate where the asset value appreciation is a major part of the exit strategy.
The monthly break-even point is reached in March 2026, assuming you hit your Year 1 revenue target of $2,070,000. The biggest lever for break-even is occupancy; if you can fill rooms faster than planned, you'll cover that $22,000 monthly lease rent and $75,000 manager salary much sooner.
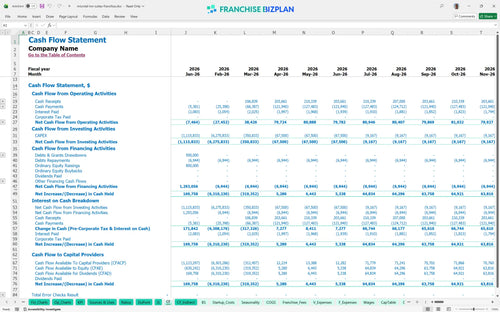
Your lowest cash point occurs in March 2026 at -$6,460,000, which is when the final construction bills and pre-opening costs hit. You defintely need to ensure your financing is staged correctly to cover this gap before the $2.07M in annual revenue begins to stabilize your cash flow.
A High scenario with better occupancy can significantly improve the -1.67% IRR, while a Low scenario might extend the payback period well beyond Year 7. Since EBITDA scales from $767k to $1.17M, even a 5% swing in RevPAR (Revenue Per Available Room) has a massive impact on your ability to service debt.
This hotel franchise financial model is a fully editable Excel tool that lets you plug in your own local market data to see the real-world impact on your bottom line. You can adjust everything from room rates to staffing levels, and the pre-filled formulas will automatically update your 5-year projections to ensure your hotel franchise startup costs analysis is accurate.

Planning a hotel investment requires a long-term view, and this model delivers with detailed 5-year revenue and cash flow forecasts. By mapping out the growth from $2,070,000 in Year 1 to over $3,031,000 in Year 5, you can see exactly how the ramp-up affects your long-term hospitality industry investment metrics and overall asset value.

Managing the franchise royalty fee structure is critical for maintaining store-level margins in the economy hotel sector. This tool tracks the 5% royalty and 2% marketing fund contributions, so you know exactly how much of your $1.2M annual room revenue is committed to the brand before you cover your local operating overhead.

This franchise unit business plan template breaks down the massive $8.1M initial investment into clear categories like construction, equipment, and site development. It calculates the exact sales volume you need to cover your $22,000 monthly lease rent and other fixed costs, helping you find your way to a sustainable operating margin.

We've baked in industry-standard benchmarks to help you sanity-check your hotel operational expense management and performance expectations. Whether it's the 3% food cost for breakfast or guest supply percentages, these numbers ensure your model reflects the reality of running a limited-service hotel in a competitive market.


Simply purchase and download the financial model template, then access it instantly using Microsoft Excel or Google Sheets. No installation or technical expertise required-just open and start working.

Enter your business-specific numbers, including revenue projections, costs, and investment details. The pre-built formulas will automatically calculate financial insights, saving you time and effort.

Leverage the investor-ready format to confidently showcase your financial projections to banks, franchise representatives, or investors. Impress stakeholders with clear, data-driven insights and professional reports.

Leverage the investor-ready format to confidently present your projections to banks, franchise representatives, or investors.