
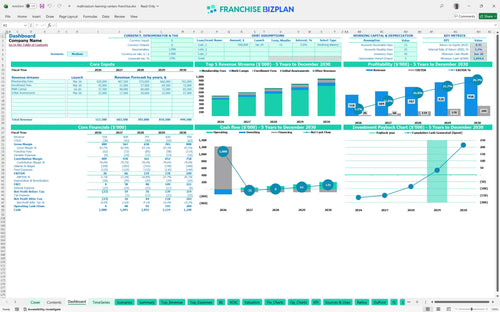
All-in-one Dashboard
Core inputs and core outputs


This Excel template for franchise unit cash flow analysis includes integrated income statements, cash flow tracking, and CAPEX schedules designed specifically for supplemental education owners.
Core inputs and core outputs
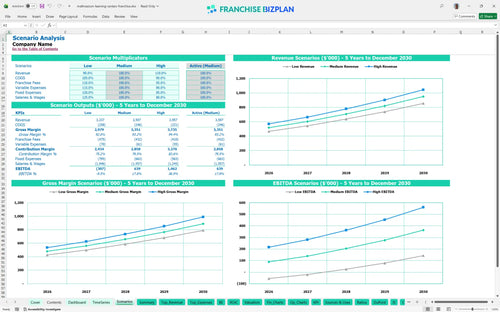
Three scenario analysis
Presentation ready
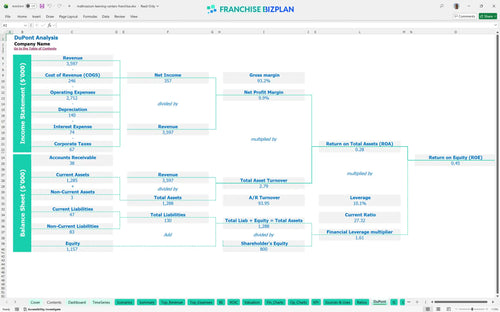
DuPont analysis
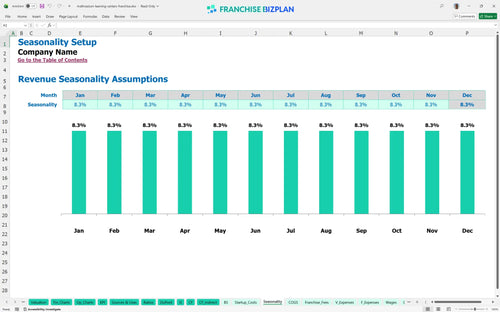
Researched revenue assumptions
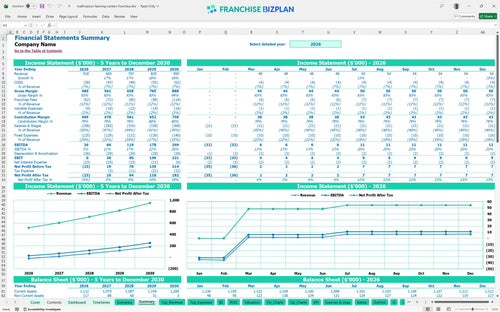
Lender-friendly financial outputs
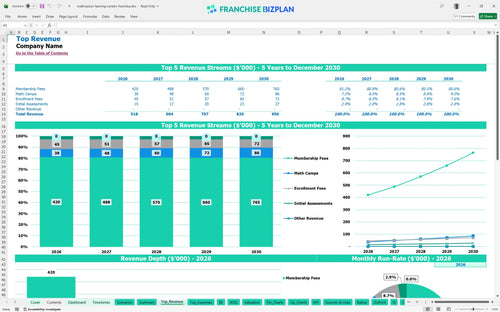
Revenue stream detailed view
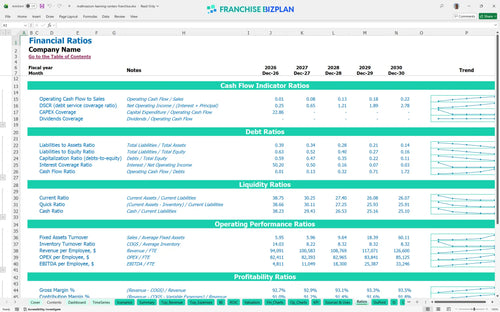
Performance metrics benchmark
We built this franchise unit financial model using our own research into the supplemental education sector. Key assumptions, including the $280,000 initial membership revenue and the $7,000 monthly prime location rent, are pre-populated and fully editable to match your specific territory. This model provides the clarity needed to manage a unit from the first $26,000 in EBITDA to mature-store performance.
You can expect this unit to hit positive EBITDA quickly, reaching $26,000 in year one and scaling to $249,000 by year five. The model shows profitability is driven by the recurring membership model, which offsets the 10% royalty and fixed occupancy costs. Profitability is the only metric that keeps the lights on.
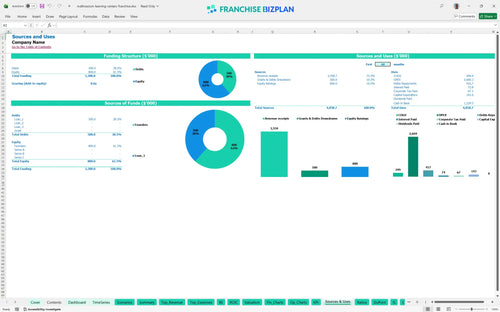
To launch this unit, you will need approximately $143,000 in initial capital to cover the franchise fee, leasehold improvements, and equipment. This financial planning for new education franchise locations ensures you have enough runway before the April 2026 breakeven date. Cash is the fuel for your center's engine.
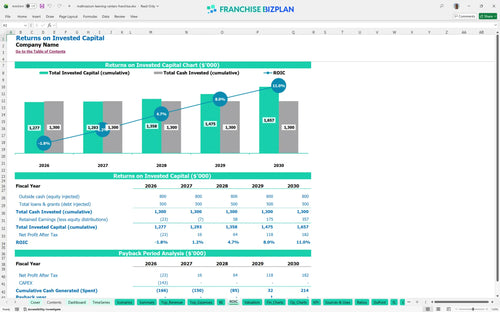
Evaluating franchise investment performance shows a 4-year payback period and an IRR of 3.18%. While the initial return seems modest, the ROE of 0.45 and the steady climb in annual revenue to $950,000 suggest a stable long-term play for multi-unit operators. Returns are earned through consistent operational excellence.
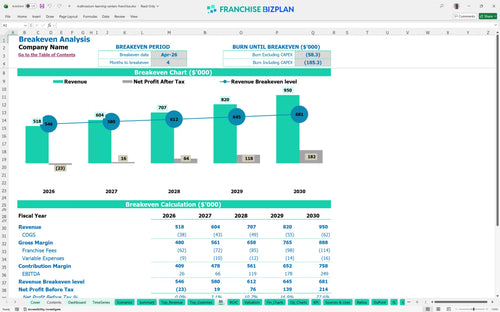
The unit hits its break-even date in April 2026, just four months after opening. This quick ramp-up is possible because membership fees are projected to hit $280,000 in the first year, though high fixed costs like the $7,000 monthly rent mean you must maintain high student density. Speed to break-even reduces your overall risk profile.
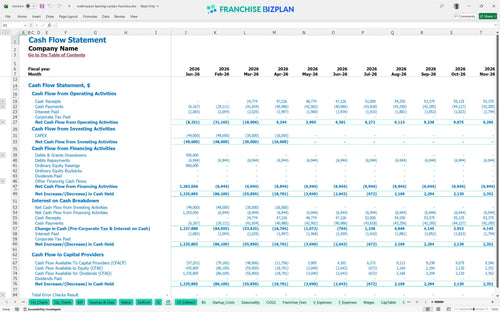
Your lowest cash point is defintely January 2028, where the model shows a minimum cash balance of $1,044,000. You need to manage the timing between paying instructors and collecting monthly tuition to avoid short-term crunches during seasonal dips. Watch the pennies and the dollars will follow.
A franchise unit profitability analysis reveals that a 10% drop in enrollment in the Low scenario can delay payback by over a year. Conversely, the High scenario leverages the fixed $7,000 rent to significantly boost year-1 margins, as most new revenue flows straight to the bottom line. Preparation for the worst allows for the best.
This franchise financial model template is built in Excel with open formulas, letting you swap out local rent or teacher pay rates without breaking the math. You can adjust membership pricing or enrollment fees to see how small tweaks impact your bottom line in real-time. Small tweaks impact your bottom line in real-time.

Map out your long-term growth from the first student to a mature location with 5-year revenue, cost, and cash flow views. This small business P&L template helps you visualize the jump from $518,000 in year one to $950,000 by year five as your local reputation grows. Growth is a marathon, not a sprint.

Estimating franchise royalty and marketing fees is critical since they take a combined 12% off the top of your monthly recurring revenue model for tutoring centers. The model automatically calculates these payments so you see exactly how much cash stays in your pocket after the franchisor gets their cut. The franchisor gets paid first, so you must plan accordingly.

Use this tool to calculate the $143,000 needed for build-out, equipment, and that initial $49,000 fee. A clear break-even analysis for private tutoring centers shows you exactly when monthly tuition covers your $7,000 rent and instructor payroll. Knowing your floor is as important as knowing your ceiling.

Compare your projections against standard educational franchise business plan data to ensure your curriculum costs, starting at 5.5%, stay in line. These benchmarks help you spot if you are overspending on local marketing or if your staffing ratios are too heavy for your current enrollment. Don't fly blind when industry data is available.


Simply purchase and download the financial model template, then access it instantly using Microsoft Excel or Google Sheets. No installation or technical expertise required-just open and start working.

Enter your business-specific numbers, including revenue projections, costs, and investment details. The pre-built formulas will automatically calculate financial insights, saving you time and effort.

Leverage the investor-ready format to confidently showcase your financial projections to banks, franchise representatives, or investors. Impress stakeholders with clear, data-driven insights and professional reports.

Leverage the investor-ready format to confidently present your projections to banks, franchise representatives, or investors.