
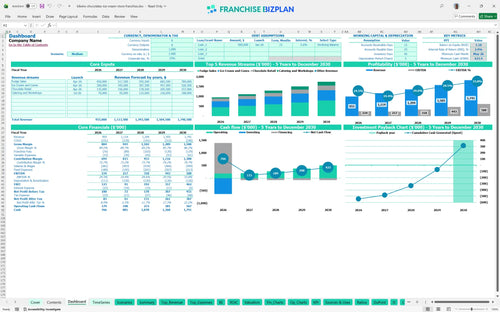
All-in-one Dashboard
Core inputs and core outputs


This financial model template for retail food franchises provides a comprehensive Excel-based system to forecast revenue, manage startup costs, and track long-term profitability for a premium dessert retail location.
Core inputs and core outputs
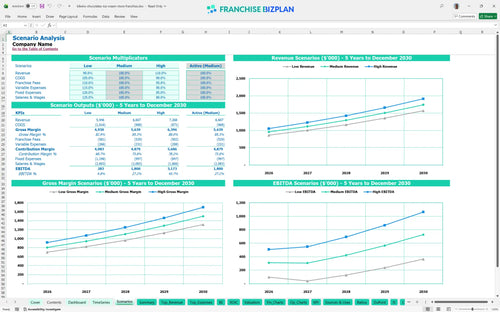
Three scenario analysis
Presentation ready
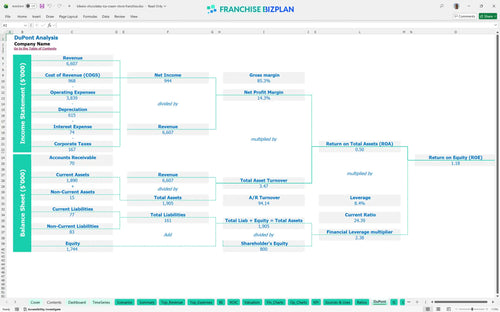
DuPont analysis
Researched revenue assumptions
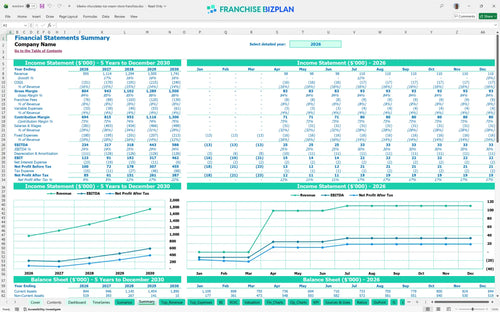
Lender-friendly financial outputs
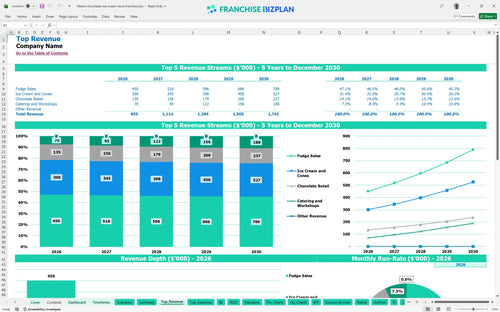
Revenue stream detailed view
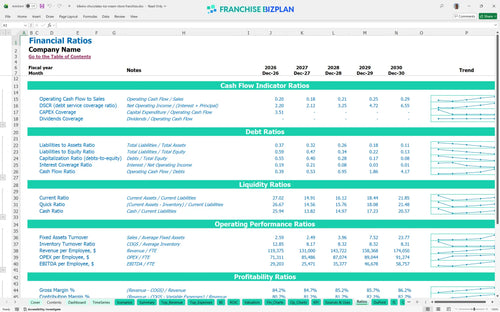
Performance metrics benchmark
We built this franchise unit financial model using deep research into the confectionery and ice cream sector. Key assumptions, including the $40,000 franchise fee and the $280,000 leasehold improvement estimate, are pre-populated and fully editable to match your specific site. With Year 1 EBITDA projected at $234,000, this model helps you validate if the local foot traffic supports the high-end cost structure.
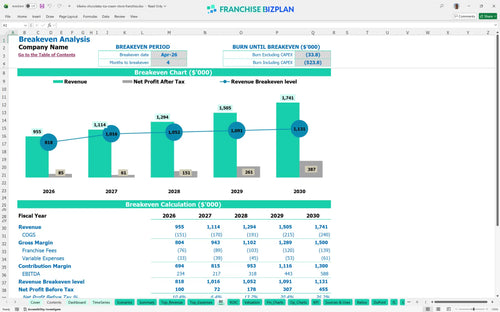
The unit hits its stride quickly, reaching operational break-even by April 2026, just four months after the initial launch phase. While Year 1 EBITDA is strong at $234,000, Year 2 sees a slight dip to $217,000 as staffing scales to 5.5 FTEs before climbing to $588,000 by Year 5 as revenue hits $1.74M. This is how to estimate profitability for a dessert franchise using real-world ramp-up curves.
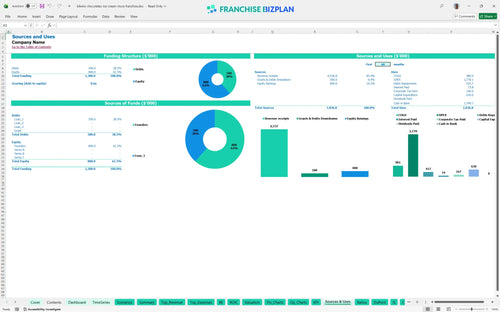
You will need approximately $630,000 to $650,000 to launch this unit, covering everything from the $40,000 initial fee to the $90,000 ice cream equipment package. The model accounts for a minimum cash need of $623,000 to handle the build-out and initial operating losses before the April break-even date. This shows you how to calculate startup costs for an ice cream franchise with precision.
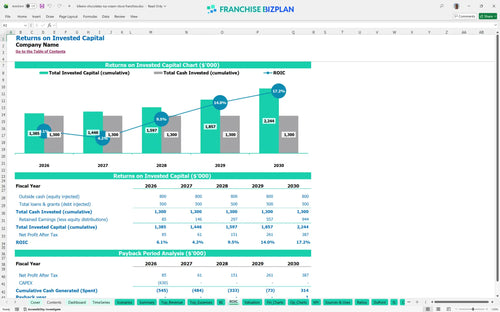
This investment offers a 5-year payback period with an Internal Rate of Return (IRR) of 2.89% and a Return on Equity (ROE) of 1.18. While the initial years focus on recovering the heavy $280,000 leasehold investment, the long-term cash flow profile strengthens significantly by Year 4 and 5. This franchise financial feasibility study template provides the ROI calculation needed for bank financing or partner pitches.
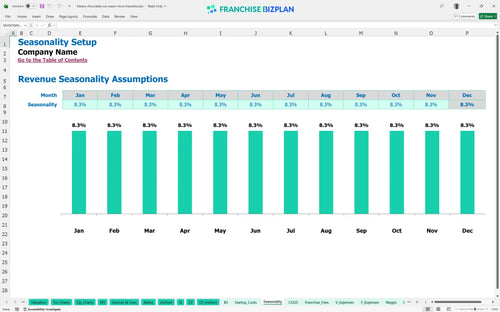
The unit reaches break-even in April 2026, requiring about four months of operation to cover its $10,500 monthly rent and fixed utilities. The primary driver for reaching this point is the high-margin fudge sales, projected at $300,000 in the first year, which provides the necessary contribution margin to offset fixed overhead. Forecasting revenue for seasonal food franchises requires this level of monthly detail to manage off-peak months.
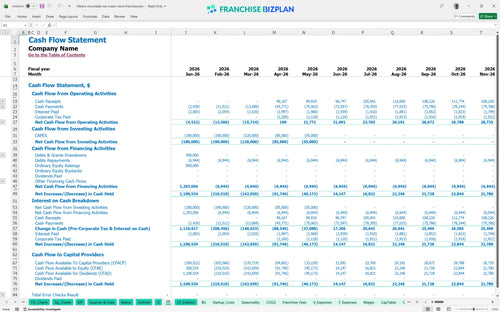
The lowest cash point occurs in May 2026, with a minimum cash requirement of $623,000. This reflects the heavy front-loaded CAPEX for equipment and signage. You need to maintain a tight grip on working capital during the first 120 days to ensure the $35,000 signage and POS costs do not overextend your liquidity. Detailed operating cost analysis for chocolate retail stores is the only way to avoid a mid-build cash crunch.
A 10% drop in revenue significantly delays the 5-year payback and increases the peak cash need beyond $623,000. Conversely, hitting the High Case through successful catering and workshops-which start at $70,000 and grow to $188,000-can pull the payback period forward and boost the Year 1 margin. This business model template for gourmet dessert shops includes a franchise unit performance tracking template to monitor these variances in real-time.
Finance: update unit break-even and payback model by Friday.
This ice cream franchise financial model is a fully editable Excel tool designed for precision. You can swap pre-filled assumptions for your specific territory reality, from local labor rates to specific lease terms. It handles the heavy lifting of math so you can focus on the strategy of the build-out. This Excel spreadsheet for franchise unit financial planning includes all necessary operating expenses to ensure your projections are grounded in reality.

Multi-unit success requires looking past the grand opening. This tool provides a detailed 5-year view of revenue, expenses, and cash flow to support your chocolate shop business plan. With Year 1 revenue projected at $955,000 and scaling to over $1.7M by Year 5, you need to see how margins evolve as your team matures and throughput increases. A deep franchise profitability analysis is essential for any operator looking to scale from one to five locations. Use this for accurate revenue forecasting across multiple years.

Operating under a brand means managing specific top-line taxes like the 5% royalty and 3% marketing fee. This model tracks these monthly obligations automatically based on your sales volume. At $1.1M in Year 2 sales, that is $88,000 in brand-related costs you must cover before paying your own rent or staff. Understanding the franchise fee structure is the first step in protecting your store-level margin.

Launching a high-end retail shop requires significant upfront capital for leaseholds and specialized gear. This franchise startup cost template maps out the $630,000+ needed to get the doors open. It calculates exactly when your monthly gross profit covers your $10,500 rent and other fixed costs, defintely helping you manage early-stage risk. This investment breakdown for high-end retail franchises ensures no hidden costs surprise you during construction. A clear break-even analysis is your roadmap to sustainability.

Don't guess on your margins. The model includes built-in retail franchise financial projections for key metrics like ingredients, which start at 13.8% of sales, and labor costs for a full team including a $70,000 manager. Comparing your local estimates against these standard benchmarks ensures your business plan is grounded in reality rather than optimism. Use these numbers to verify your staffing levels and occupancy costs against industry norms.


Simply purchase and download the financial model template, then access it instantly using Microsoft Excel or Google Sheets. No installation or technical expertise required-just open and start working.

Enter your business-specific numbers, including revenue projections, costs, and investment details. The pre-built formulas will automatically calculate financial insights, saving you time and effort.

Leverage the investor-ready format to confidently showcase your financial projections to banks, franchise representatives, or investors. Impress stakeholders with clear, data-driven insights and professional reports.

Leverage the investor-ready format to confidently present your projections to banks, franchise representatives, or investors.