
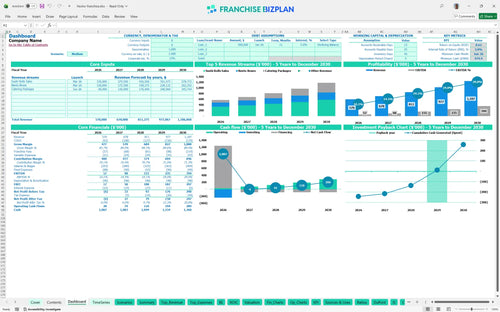
All-in-one Dashboard
Core inputs and core outputs


This comprehensive Excel template for food franchise financial planning includes pre-built revenue drivers, detailed expense tracking, and investor-ready reporting for a retail food unit.
Core inputs and core outputs
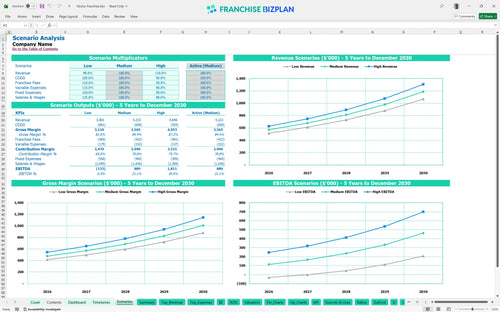
Three scenario analysis
Presentation ready
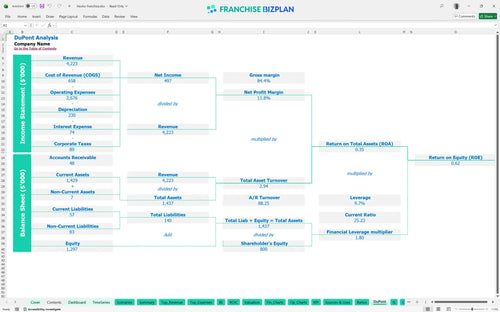
DuPont analysis
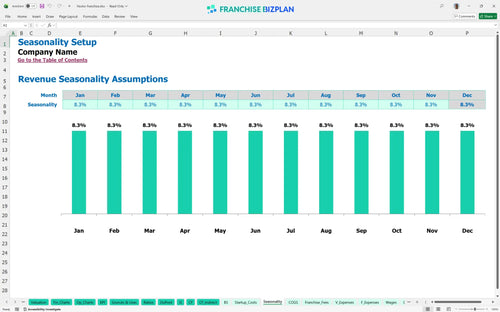
Researched revenue assumptions
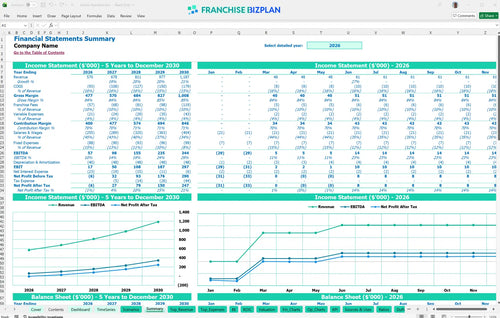
Lender-friendly financial outputs
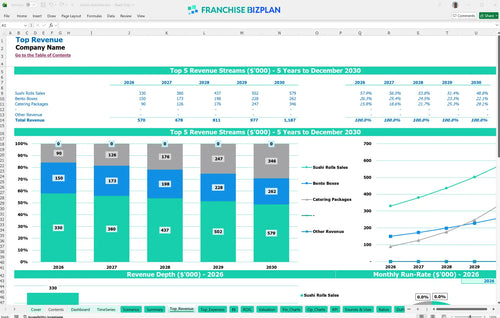
Revenue stream detailed view
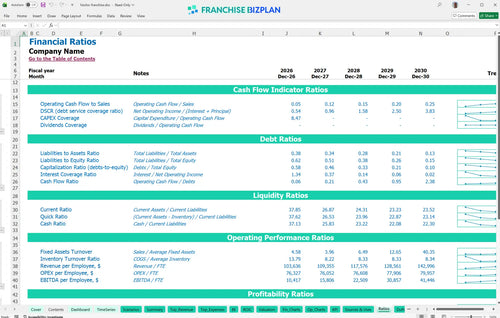
Performance metrics benchmark
We developed this franchise business plan template through deep-dive research into the sushi kiosk sector. The model comes pre-loaded with specific data like the $5,000 monthly rent and the 8% royalty fee, but you can change everything to fit your local market. With a projected Year 5 revenue of $1,187,000 and a 4-year payback, this franchise investment analysis tool gives you the data-driven confidence to talk to lenders or partners.
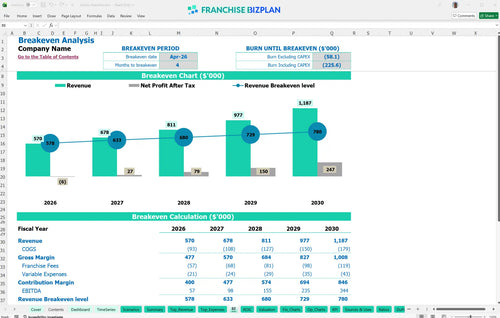
Based on our data, this unit hits its break-even date in April 2026, just four months after launching. While year one EBITDA starts at $57,000, the model shows a steady climb to $344,000 by year five as catering revenue scales. Honestly, your speed to profit depends on hitting that $570,000 revenue target in the first twelve months.
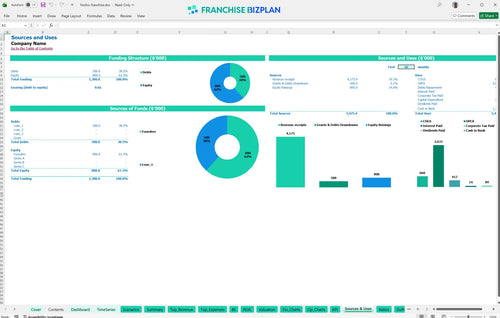
To get this kiosk off the ground, you are looking at a startup cost breakdown for retail sushi franchise operations totaling $237,500 in hard assets and fees. This includes the $7,500 franchise fee and a heavy $120,000 investment in kiosk buildout improvements. You'll also need to account for the minimum cash requirement of $975,000 to handle the ramp-up phase safely.
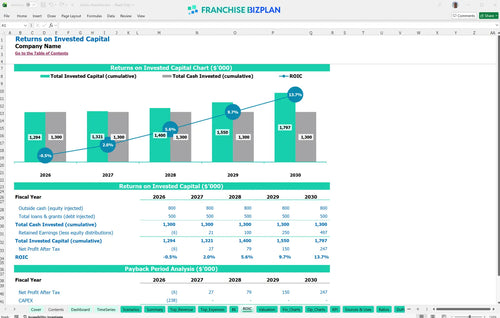
The calculating ROI for urban food kiosk franchise shows a payback period of 4 years, which is fairly standard for food service. With an Internal Rate of Return (IRR) of 3.05% and a Return on Equity (ROE) of 0.62, the model suggests steady growth. Still, the real value is in the 5-year cash flow that eventually hits $1,187,000 in annual revenue.
You need to hit your break-even point by month 4 to stay on track with the model's projections. The biggest drag on your break-even is the $5,000 monthly rent combined with the 10% total franchise and marketing fees. If your sushi roll sales don't hit the $220,000 mark in year one, you'll defintely need more working capital to cover the fixed costs.
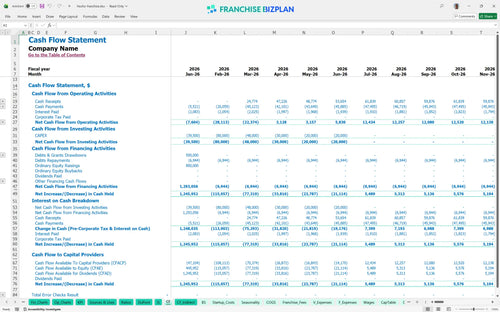
The lowest cash point occurs in June 2026, where the model shows a minimum cash need of $975,000. This estimate hides the fact that your initial buildout and equipment costs hit before the first roll is sold. You need at least six months of operating runway to handle the gap between opening and the April break-even date.
Our franchise profitability analysis for retail food units looks at how a 10% drop in revenue can push your payback period past the 5-year mark. In the high-growth scenario, where catering packages exceed the $60,000 year-one estimate, your year-1 margin improves significantly. Changing the assistant chef FTE from 1.0 to 1.8 over five years is a major variable that dictates your peak cash need.
This franchise financial model template lives in Excel, so you aren't locked into a static PDF. You can tweak every assumption from sushi roll pricing to hourly wages for your assistant chefs. It's built for the realist who knows that a kiosk in a high-traffic urban area has different utility costs than a standard food court spot. Since the formulas are pre-filled, you can spend your time analyzing the unit economics instead of fixing broken spreadsheet cells.

Mapping out your path from $570,000 in year one to over $1.1M by year five requires more than just hope. This franchise unit cash flow projection template tracks your scale, accounting for how catering packages and bento box sales grow over time. It gives you a clear look at the long-term franchise profit and loss projection so you can see when the unit truly matures. Plus, the 5-year view helps you communicate the long-term vision to potential lenders or partners.

Royalties and marketing funds are the franchise tax that can eat your margin if you don't plan for them. This tool calculates the 8% royalty and 2% marketing fee automatically against your gross sales. By seeing these franchise royalty fees side-by-side with your fresh fish costs, you get an honest look at your store-level EBITDA. It's the best way to ensure your financial forecasting for small retail franchise operations stays grounded in brand reality.

Launching a retail food unit involves a lot of upfront checks, from the $120,000 buildout to the $12,000 POS system. Our franchise startup cost calculator helps you total these figures so you know exactly how much skin you need in the game. Plus, the break-even analysis shows the exact month you stop burning cash and start keeping it. This is essential for anyone using a financial template for franchise business acquisition to justify the entry price.

Don't guess if your 14.5% fish cost is too high; use our built-in benchmarks to verify. The model compares your unit economics against industry standards for quick-service kiosks. This helps you spot if your estimating labor costs for food service franchise operations are out of whack before you sign a lease. It's a pragmatic way to ensure your operational expenses don't spiral during the first year of trading.


Simply purchase and download the financial model template, then access it instantly using Microsoft Excel or Google Sheets. No installation or technical expertise required-just open and start working.

Enter your business-specific numbers, including revenue projections, costs, and investment details. The pre-built formulas will automatically calculate financial insights, saving you time and effort.

Leverage the investor-ready format to confidently showcase your financial projections to banks, franchise representatives, or investors. Impress stakeholders with clear, data-driven insights and professional reports.

Leverage the investor-ready format to confidently present your projections to banks, franchise representatives, or investors.