
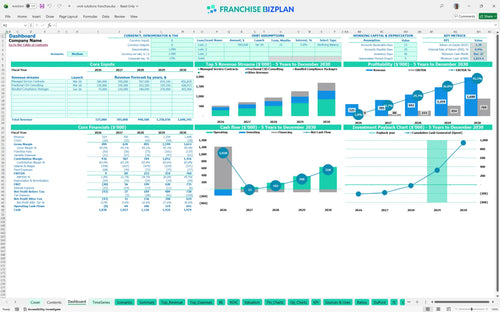
All-in-one Dashboard
Core inputs and core outputs


This tool provides a complete financial projection model for technology franchises, covering everything from initial CapEx to five-year EBITDA growth and cash flow management.
Core inputs and core outputs
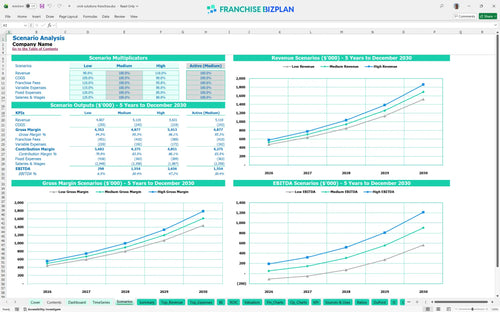
Three scenario analysis
Presentation ready
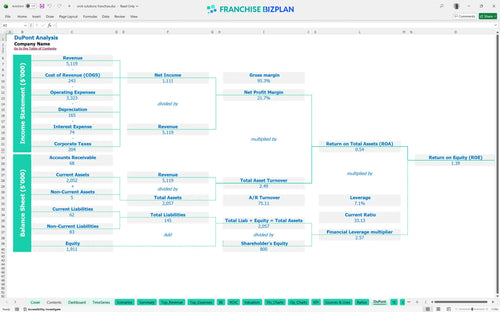
DuPont analysis
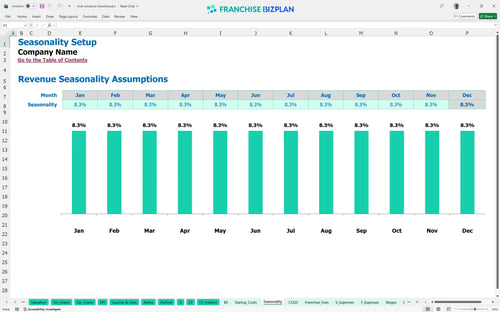
Researched revenue assumptions
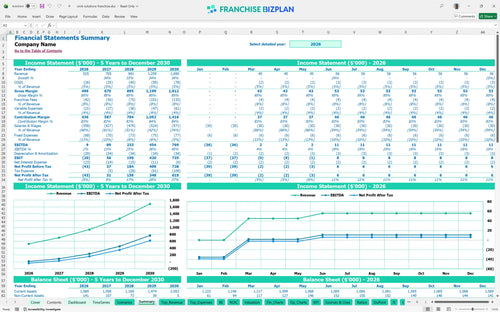
Lender-friendly financial outputs
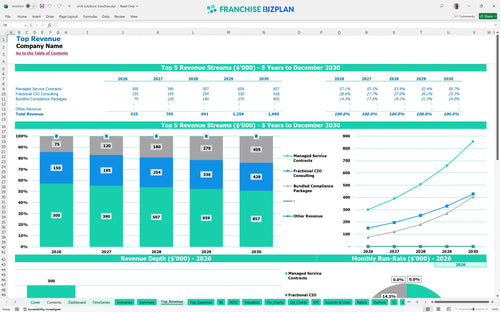
Revenue stream detailed view
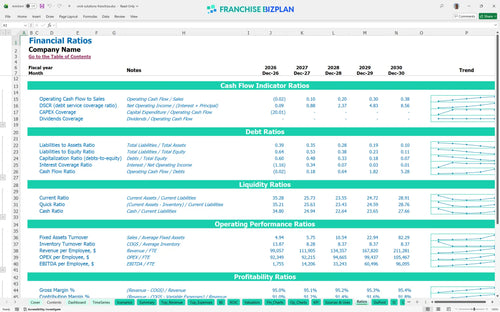
Performance metrics benchmark
We built this franchise unit financial model using our own research into the managed IT services sector to help you evaluate franchise unit financial performance. Key assumptions like the $525,000 year-one revenue and the 4-year payback period are pre-populated and fully editable to reflect your specific territory. This model uses real-world franchise profitability metrics to guide your investment decision. Data beats intuition every single time.
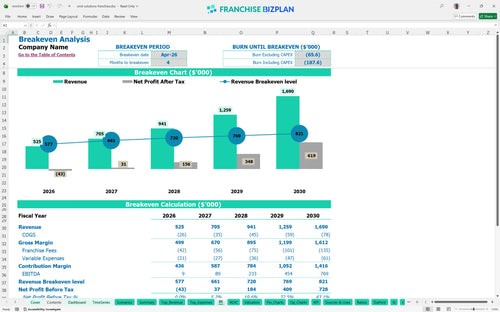
This unit reaches a positive EBITDA of $9,000 in its first year, scaling significantly to $769,000 by year five as recurring contracts mature. Profitability depends on managing the 8% total franchise fee burden while scaling high-margin fractional CIO consulting revenue. Cash flow is the only metric that pays the rent.
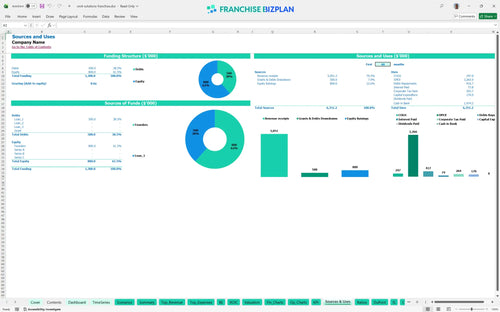
You need approximately $169,950 in startup capital requirements for the initial build-out and equipment. This covers the $49,950 franchise fee, $35,000 for leasehold improvements, and $25,000 for workstations and servers to get the flagship facility operational. Your initial check is just the beginning of the ramp-up phase.
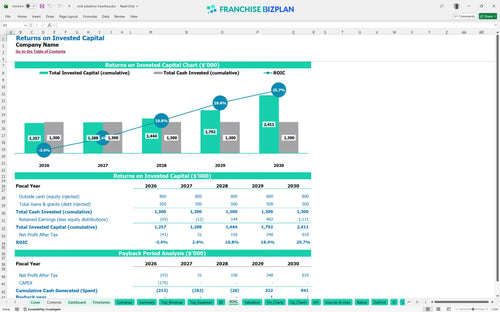
The ROI analysis shows an Internal Rate of Return (IRR) of 4.85% and a Return on Equity (ROE) of 1.39. With a 4-year payback period, the model demonstrates how the recurring revenue model builds long-term equity for the owner through steady contract growth. Time is your most expensive asset during the early years.
The unit hits its break-even date in April 2026, just four months after launching services. Reaching this point quickly relies on securing $200,000 in managed service contracts early to cover the $5,700 in monthly overhead plus the professional payroll. Fixed costs are the enemy of early-stage flexibility.
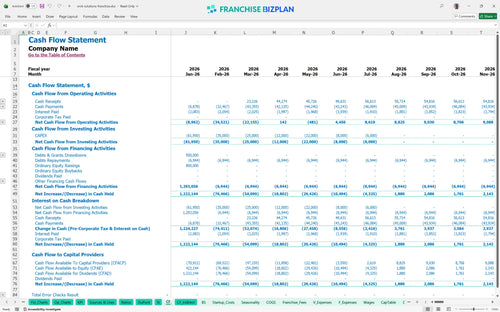
The minimum cash point occurs in December 2027 at $1,023,000, suggesting a significant capital buffer is maintained throughout the ramp-up. However, if revenue forecasting for B2B technology franchises misses targets, you must monitor the timing of the $22,000 vehicle purchase. A cash buffer is your insurance against the unknown.
Financial planning for new franchise owners must account for volatility in contract signings. A high-performance scenario significantly boosts the $769,000 year-5 EBITDA, while a low-revenue case could extend the 4-year payback period if fixed costs aren't adjusted. Scenarios prepare you for the real world.
Finance: update unit break-even and payback model by Friday.
This Excel template for franchise financial forecasting allows you to adjust every variable of your IT service operation, from managed contract pricing to field technician headcount. With pre-filled formulas and editable assumptions, you can defintely simulate different Austin-market scenarios to see how local demand impacts your bottom line. Use this franchise investment calculator to stress-test your assumptions before signing a lease. Every 1-point margin leak matters fast in a single-unit model.

Planning for a managed IT services franchise profitability analysis requires a long-range view of how recurring revenue scales over time. This model tracks your trajectory from $525,000 in year one to a mature $1,690,000 by year five, providing clear pro forma financial statements for lenders and partners. It maps the transition from a startup phase to a high-EBITDA operation. Recurring revenue is the bedrock of your long-term business valuation.

Estimating franchise royalty and marketing fees is critical for protecting your store-level margin from day one. The model automatically calculates the 6% royalty and 2% marketing fund contribution against your projected revenue streams, ensuring you understand exactly how much goes to the franchisor before you pay your own bills. This transparency helps you plan for the $68,000+ in annual fees expected by year three. Royalties are a top-line tax you must outpace with efficiency.

Determining initial investment for managed IT businesses involves more than just the $49,950 franchise fee. This tool includes a break-even analysis for service-based franchise units, showing you exactly how to calculate startup costs for an IT franchise including leaseholds and equipment. You will see the specific sales volume required to cover your $3,500 monthly rent and professional staff salaries. Speed to break-even is your best risk mitigator in a new territory.

Use this IT franchise business plan to compare your labor costs and gross margins against established standards for technology service providers. By tracking metrics like the 3.8% software license cost or the $75,000 IT manager salary, you can sanity-check your unit economics against typical managed service provider startup costs. This ensures your projections remain grounded in the reality of the Austin labor market. Benchmarks keep your assumptions grounded in reality.


Simply purchase and download the financial model template, then access it instantly using Microsoft Excel or Google Sheets. No installation or technical expertise required-just open and start working.

Enter your business-specific numbers, including revenue projections, costs, and investment details. The pre-built formulas will automatically calculate financial insights, saving you time and effort.

Leverage the investor-ready format to confidently showcase your financial projections to banks, franchise representatives, or investors. Impress stakeholders with clear, data-driven insights and professional reports.

Leverage the investor-ready format to confidently present your projections to banks, franchise representatives, or investors.