
All-in-one Dashboard
Core inputs and core outputs


This comprehensive franchise financial model template includes a 5-year projection tool, detailed startup cost calculators, and pre-built B2B service revenue drivers.
Core inputs and core outputs
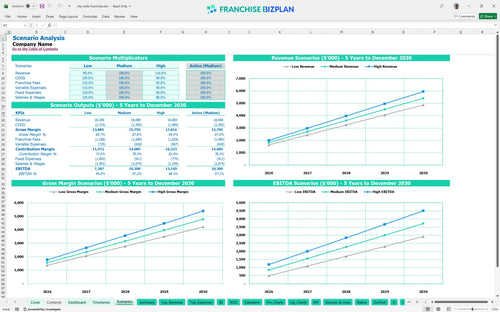
Three scenario analysis
Presentation ready
DuPont analysis
Researched revenue assumptions
Lender-friendly financial outputs
Revenue stream detailed view
Performance metrics benchmark
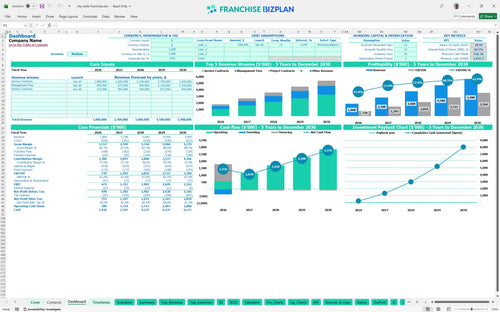
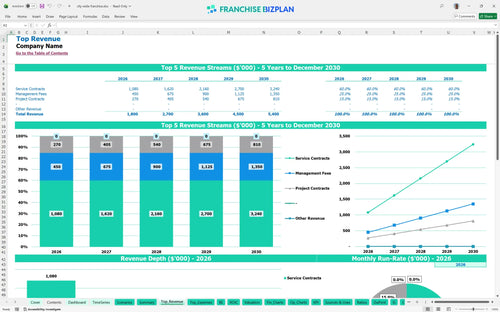
We built this financial model for a commercial building services franchise using deep research into B2B service operations and recurring revenue franchise opportunities. Key assumptions, including the $1.8M year-one revenue and the asset-light franchise model cost structure, are pre-populated and fully editable. This tool provides a clear view of the $3.39M EBITDA potential by year five.
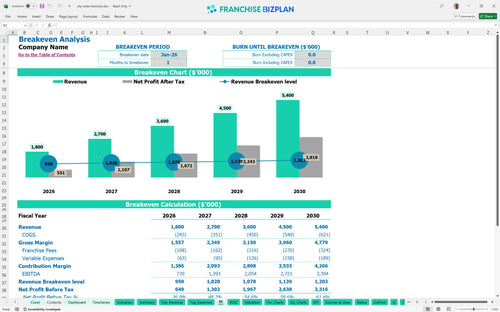
This franchise unit becomes profitable almost immediately, reaching its break-even point in January 2026. By the end of year one, the model projects an EBITDA of $739,000 after accounting for 5% royalties and subcontractor costs. Profitability depends on maintaining a tight 12% subcontractor payment rate.
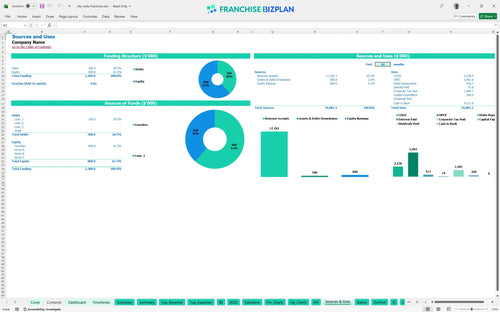
Launching this unit in the US requires $360,000 in startup capital, with $120,000 allocated to office improvements and $70,000 for the franchise fee. The model also includes $45,000 for company vehicles and $35,000 for IT equipment. This startup budget template for service-oriented franchises ensures you don't miss hidden costs.
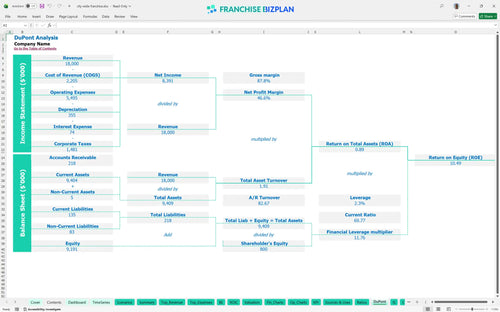
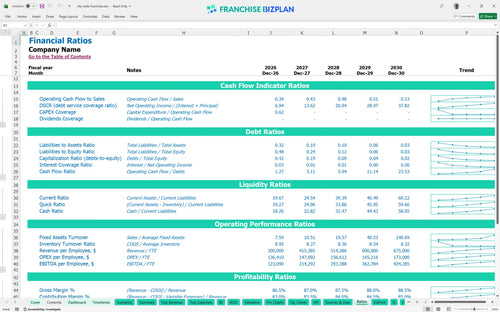
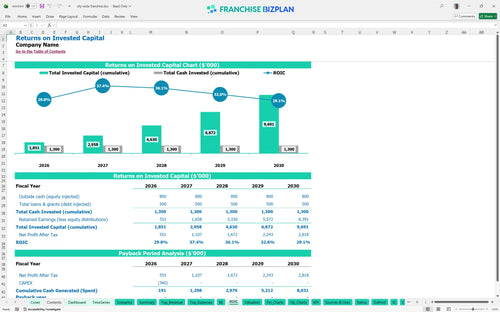
Franchisees can expect an Internal Rate of Return (IRR) of 18.11% and a Return on Equity (ROE) of 10.49%. While the unit generates strong annual EBITDA, the ROI analysis for commercial maintenance franchise units shows payback occurs after year five due to the significant initial CAPEX. High cash flow starts early, but full recovery takes time.
The unit reaches break-even in month one, requiring enough revenue to cover approximately $14,300 in fixed monthly overhead. The main driver for hitting this target is the volume of service contracts, which start at $720,000 in the first year. Estimating profitability for B2B service franchises is easier when you know your fixed floor.
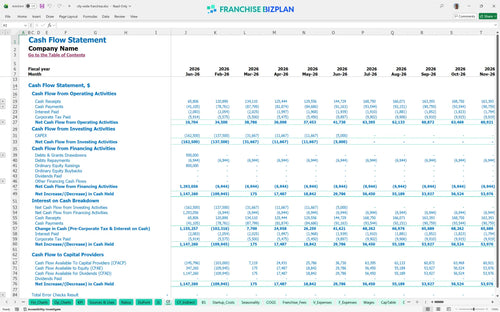
The lowest cash point is $1,037,000 in February 2026, assuming you start with sufficient initial funding. You need a solid runway to handle the timing gap between paying subcontractors and receiving client management fees. Financial forecasting for commercial cleaning and facility services must prioritize this cash gap.
A high-growth scenario improves the 18.11% IRR by maximizing the productivity of account executives as revenue scales toward $5.4M. If revenue lags, the $110,000 GM salary and $9,500 monthly rent will pressure year-one margins. This asset-light franchise business model analysis shows that volume is the key to diluting fixed costs.
This franchise financial model template is built in Excel, allowing you to modify every pre-filled formula and assumption to fit your specific territory. You can adjust local labor rates or office rent to see how they impact your bottom line before signing a lease. It is a flexible tool designed for real-world franchise unit economics analysis. One wrong assumption can sink a deal, so we made everything editable.

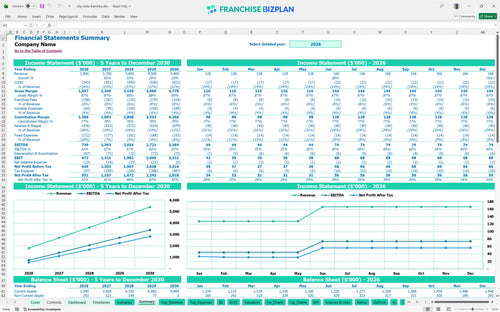
Map your growth from a $1.8M year-one revenue target to a mature $5.4M operation using detailed 5-year projections. This view tracks cash flow and profit trends, ensuring you have the capital to scale as you add account executives and expand your client base. Long-term planning is the only way to manage a building services franchise financial projections. Growth requires cash, and this model shows you exactly when you need it.

The model calculates the 5% royalty and 1% marketing fund contributions automatically based on your gross sales. By factoring in the initial $70,000 franchise fee, you get a clear picture of the real economics of brand alignment. Understanding these ongoing costs is vital for any commercial maintenance franchise profitability study. Don't let the brand fees surprise your monthly cash flow.

Total initial investment is roughly $360,000, covering everything from office improvements to software implementation. This analysis identifies the exact sales volume needed to cover your $14,300 monthly fixed overhead and variable subcontractor payments. Knowing how to calculate startup costs for a facility management franchise is the first step to a safe launch. Break-even is your first major milestone.

Use built-in benchmarks to verify if your 12% subcontractor payment assumption is realistic for the facility management sector. Comparing your projected margins against industry standards helps defintely identify if your pricing strategy is competitive or too aggressive. These benchmarks act as a sanity check for your franchise business plan excel template. Real numbers beat gut feelings every time.


Simply purchase and download the financial model template, then access it instantly using Microsoft Excel or Google Sheets. No installation or technical expertise required-just open and start working.

Enter your business-specific numbers, including revenue projections, costs, and investment details. The pre-built formulas will automatically calculate financial insights, saving you time and effort.

Leverage the investor-ready format to confidently showcase your financial projections to banks, franchise representatives, or investors. Impress stakeholders with clear, data-driven insights and professional reports.

Leverage the investor-ready format to confidently present your projections to banks, franchise representatives, or investors.