
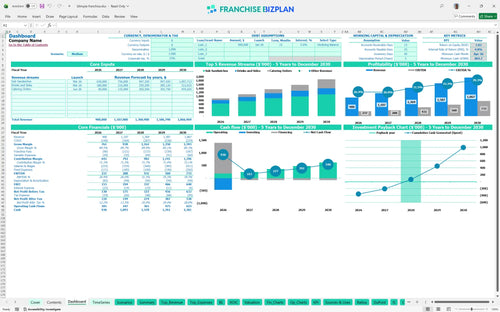
All-in-one Dashboard
Core inputs and core outputs


This product is a comprehensive Excel template for new franchise startup costs, featuring fully integrated financial statements and unit-level performance drivers.
Core inputs and core outputs
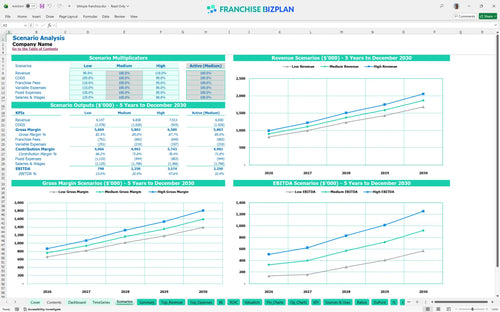
Three scenario analysis
Presentation ready
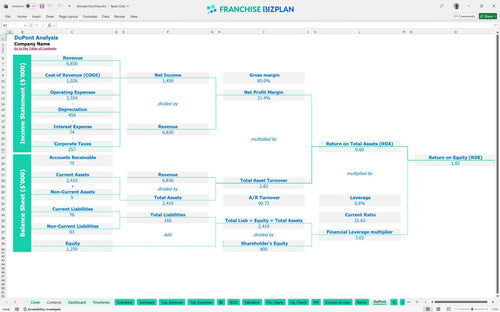
DuPont analysis
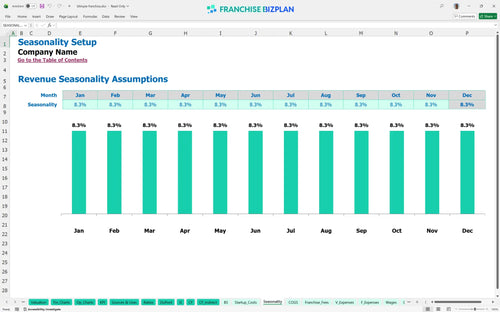
Researched revenue assumptions
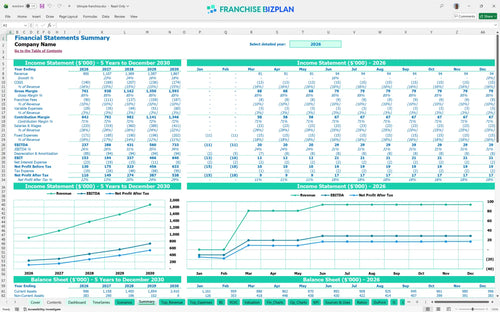
Lender-friendly financial outputs
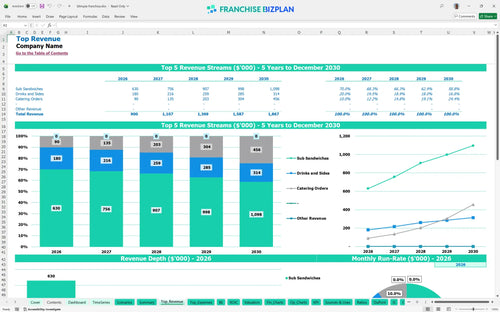
Revenue stream detailed view
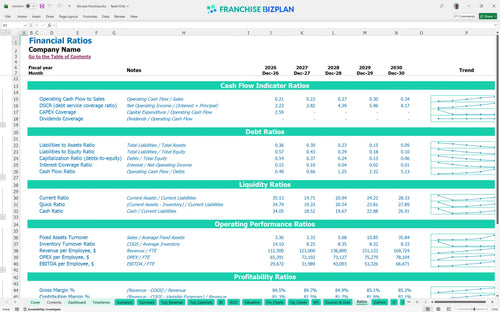
Performance metrics benchmark
We built this franchise unit financial model using detailed research on fast-casual sandwich shop performance and brand standards. Key assumptions like the 6% royalty and 4% marketing fee are pre-populated alongside a Year 1 revenue target of $900,000, and every cell is fully editable to match your specific location. This tool helps you see how the 3-year payback period holds up against $9,000 monthly rent.
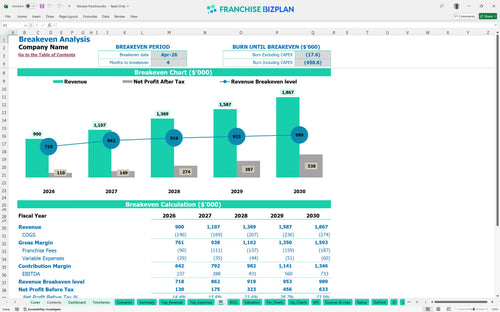
The unit reaches profitability in Year 1, generating an EBITDA of $237,000. This franchise unit profitability analysis shows that as revenue climbs toward $1.8 million by Year 5, margins expand because fixed costs like the $9,000 rent stay flat. Growth depends on moving from sandwiches to high-margin catering.
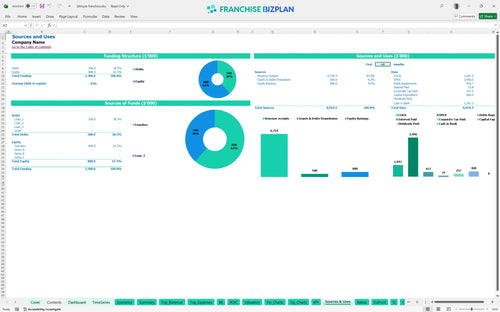
Launching this unit requires a total initial investment anchored by a $220,000 build-out and $110,000 in kitchen and refrigeration equipment. This capital expenditure forecasting includes the $18,000 franchise fee and $35,000 for POS technology to ensure you have enough liquidity for the April 2026 opening. Build-out is your biggest check; write it carefully.
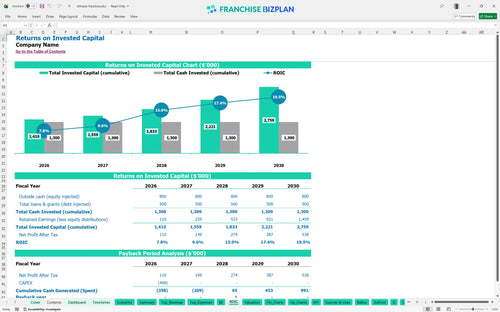
Investors can expect a 3-year payback period and an internal rate of return (IRR) of 4.81% based on the researched unit economics. This franchise ROI calculator and franchise investment return analysis tool show a return on equity of 1.82, providing a clear picture of long-term wealth creation. A three-year payback is a solid win in fast-casual.
The unit hits its monthly break-even point in April 2026, just four months after the initial launch. Estimating revenue for a new franchise location is critical here, as the $9,000 monthly rent and $242,000 annual labor cost create a high fixed-cost floor that requires consistent foot traffic. Volume is the only lever that matters for early survival.
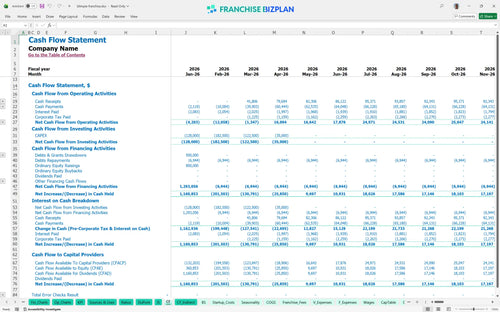
The lowest cash point occurs in April 2026, with a minimum cash balance of $803,000 required to navigate the initial ramp-up phase. These financial projections for urban retail franchise unit suggest keeping a healthy buffer to handle the $9,000 rent and insurance costs during the first few months. Cash is oxygen; don't run out during the climb.
Analyzing profitability for small business franchises requires looking at Low, Medium, and High cases; a 10% drop in revenue can delay your 3-year payback significantly. The High case, driven by corporate catering contracts reaching $303,750, dramatically accelerates Year 5 EBITDA to $733,000. Plan for the worst so you can survive to see the best.
This franchise financial model template is a professional-grade tool built in Excel to help you understand how to create a financial model for a franchise. It features editable assumptions for revenue, labor, and food costs, allowing you to adapt the restaurant business plan excel to your specific territory. It is defintely the fastest way to stress-test your unit economics before signing a lease. Flexibility is the difference between a guess and a plan.

Success in the fast-casual space requires a long-term view of cash flow and food service franchise financial projection data. This franchise unit financial forecasting software provides a detailed 5-year outlook, showing how revenue scales from $900,000 in Year 1 to $1,867,000 by Year 5. Financial planning for fast-casual restaurant franchise units is simplified with these pre-built statements. Five years of data turns a job into an asset.

Operating a branded unit involves specific costs like the 6% royalty and 4% marketing fund contribution that must be tracked accurately. This model simplifies calculating cash flow for a sandwich shop franchise by automating these deductions from your monthly operating expense budget. It ensures you see the true net margin after all corporate obligations are met. Royalties are a tax on top-line, not bottom-line.

This franchise startup cost spreadsheet maps out your total initial investment, including the $18,000 franchise fee and $220,000 build-out. The integrated break-even analysis tool identifies the exact sales volume needed to cover your $9,000 monthly rent and fixed overhead. Knowing your zero-point keeps the lights on.

Our unit economics model incorporates standard benchmarks for labor and food costs to help you sanity-check your projections. When preparing a business plan for a retail food franchise, comparing your 13.5% food cost assumption against industry averages ensures your plan is realistic and bankable. Benchmarks keep your ego in check.


Simply purchase and download the financial model template, then access it instantly using Microsoft Excel or Google Sheets. No installation or technical expertise required-just open and start working.

Enter your business-specific numbers, including revenue projections, costs, and investment details. The pre-built formulas will automatically calculate financial insights, saving you time and effort.

Leverage the investor-ready format to confidently showcase your financial projections to banks, franchise representatives, or investors. Impress stakeholders with clear, data-driven insights and professional reports.

Leverage the investor-ready format to confidently present your projections to banks, franchise representatives, or investors.