
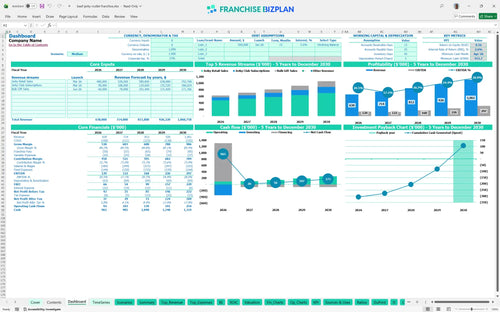
All-in-one Dashboard
Core inputs and core outputs


This franchise unit financial model template provides a complete roadmap for projecting revenue from retail sales, subscriptions, and bulk gifts while managing specific costs like royalties and downtown rent. This tool bridges the gap between a brand concept and a local P&L. It is one of the best financial templates for new franchise owners looking for precision.
Core inputs and core outputs
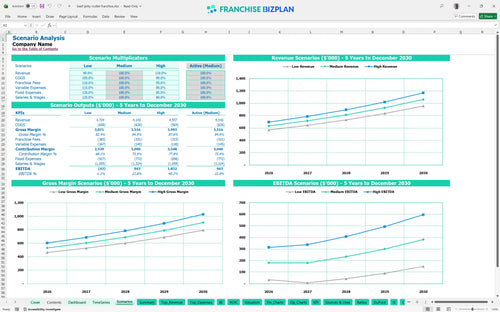
Three scenario analysis
Presentation ready
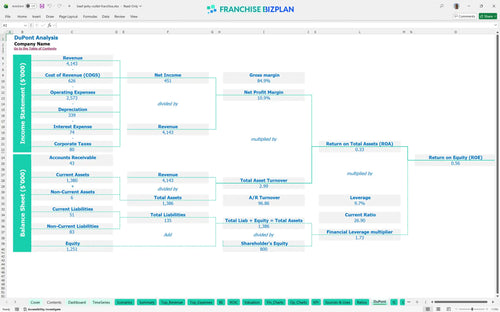
DuPont analysis
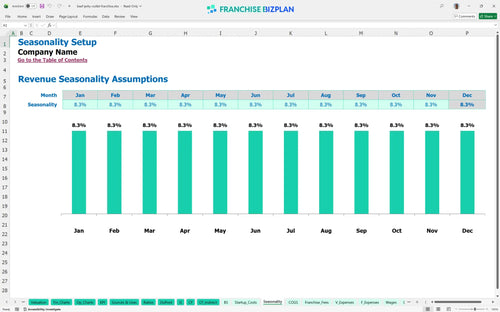
Researched revenue assumptions
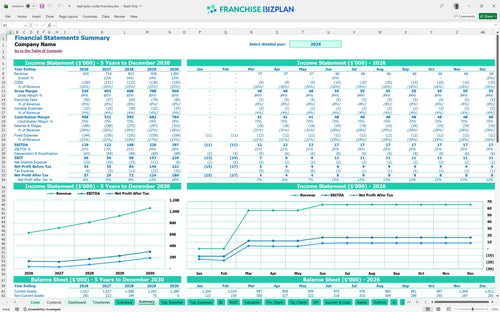
Lender-friendly financial outputs
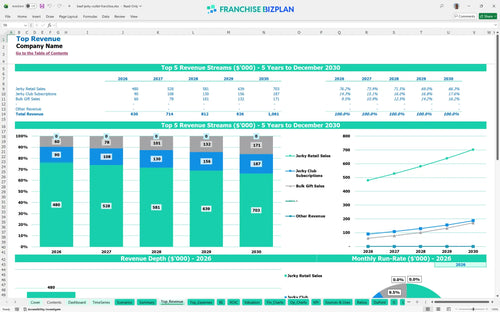
Revenue stream detailed view
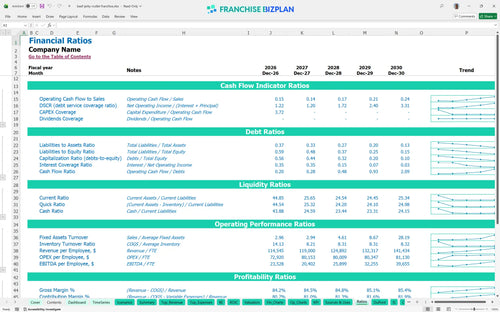
Performance metrics benchmark
We built this model using detailed research on the retail jerky sector to ensure every assumption is grounded in reality. The pre-populated data includes three distinct revenue streams and specific overhead like $8,500 for downtown rent, all of which you can edit to fit your specific location. With a Year 1 EBITDA of $129,000 and a clear path to $297,000 by Year 5, this model provides the data-driven confidence needed for a successful launch.
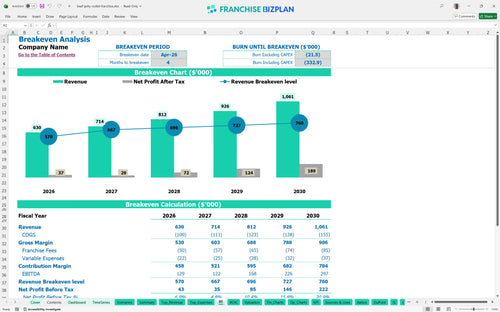
You can expect this unit to defintely hit its stride by April 2026, which is just four months after the initial launch. While Year 1 EBITDA starts at $129,000, the real franchise profitability analysis shows a jump to $297,000 by Year 5 as revenue scales past the million-dollar mark. Profitability is a marathon, not a sprint. The model accounts for the 6% royalty and 2% marketing fees that eat into your margin every month.
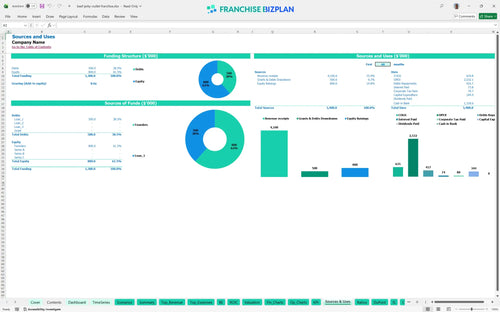
Launching this unit requires a total capital outlay of approximately $344,400 for physical assets and fees, but the model suggests a much higher cash reserve. You need to know how to estimate startup costs for a retail franchise to avoid running dry before the April 2026 breakeven. Capital allocation is where strategy meets the sidewalk. The $140,000 leasehold improvement budget is your biggest hurdle before the doors even open.
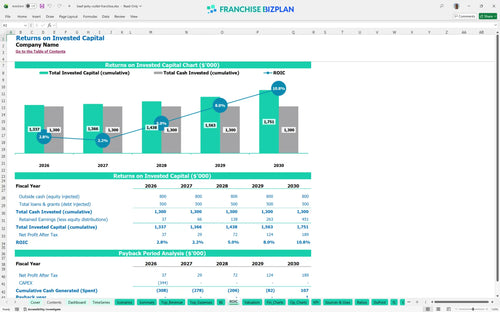
The model projects an Internal Rate of Return (IRR) of 2.6% and a Return on Equity (ROE) of 0.56 over a five-year horizon. Your ROI calculation for franchises shows a 5-year payback period, meaning you won't fully recoup your initial investment until the end of the forecast. Returns take time in a brick-and-mortar retail environment. This franchise unit financial projections template helps you visualize the slow but steady climb in net margins from Year 1 through Year 5.
Your store needs to clear its fixed costs-led by the $8,500 monthly rent and $1,300 utility bill-by April 2026 to stop the bleeding. The retail store cash flow management spreadsheet shows that retail sales volume is the primary driver, but Jerky Club subscriptions provide a vital cushion. Speed to breakeven is the most important metric for a new owner. If you miss your sales targets by even 10%, that April date will slide quickly into the summer.
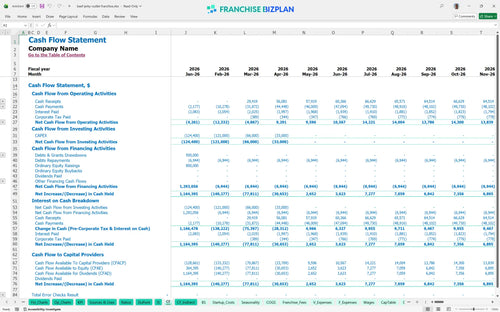
The lowest cash point occurs in April 2026, with the model indicating a minimum cash need of $916,000 to stay safe during the ramp-up. This financial planning guide for new franchise operators emphasizes that you need a significant buffer to handle the $25,000 initial inventory load and pre-opening marketing. Cash is more than just oxygen; it is your only safety net. Without this reserve, a slow first quarter could be fatal for the business.
Using this Excel financial model for specialty food franchises, you can toggle between sales targets to see how a 'High' case impacts your Year 5 EBITDA of $297,000. An operational cost analysis for retail store franchises reveals that if Jerky Purchase Costs stay at 14% while labor scales, your margins remain thin but stable. Planning for the worst helps you actually achieve the best. The model shows that hitting the $1.06M revenue mark in Year 5 is the key to a successful exit.
This franchise financial model template is built in Excel with fully editable formulas, allowing you to swap out assumptions for your specific territory and local market conditions. You can adjust everything from retail price points to hourly wages, ensuring the projections reflect your actual lease terms and staffing plan. Customization is the difference between a generic guess and a local plan.

You get a complete five-year outlook that maps out your path from grand opening to a mature multi-unit operation using pro forma financial statements. The model tracks annual revenue growth-climbing from $630,000 in Year 1 to over $1.06 million by Year 5-while accounting for escalating costs and inflation. Five years of data turns a retail dream into a bankable strategy. Small business financial forecasting requires this level of depth to secure lending or outside investment.

This tool simplifies analyzing recurring revenue streams for retail franchises by hard-coding the 6% royalty and 2% marketing fund contributions into your monthly cash flow. We also include the $49,900 initial fee in your startup costs so you can see the true franchise royalty fee impact on net profit from day one. Royalties are a permanent tax on your top line. A proper franchise disclosure document analysis helps you plug these exact percentages into the model for total accuracy.

Our franchise startup cost calculator aggregates every expense from leasehold improvements to initial inventory, giving you a clear picture of the $344,400 needed to open. By calculating break-even point for franchise units, the model identifies the exact month when your retail sales finally cover the $8,500 monthly rent and payroll. Knowing your zero-profit point keeps the lights on during the first year. It is the best way to manage expectations with your lenders and partners.

The model uses retail inventory management metrics and variable vs fixed franchise costs to help you sanity-check your store's performance against industry standards. We have pre-set jerky purchase costs at 14% and packaging at 1.8%, so you can see if your local margins are staying competitive. Benchmarks act as the guardrails for your operational spending. If your labor costs spike above the planned manager and associate salaries, the model flags the margin leak immediately.


Simply purchase and download the financial model template, then access it instantly using Microsoft Excel or Google Sheets. No installation or technical expertise required-just open and start working.

Enter your business-specific numbers, including revenue projections, costs, and investment details. The pre-built formulas will automatically calculate financial insights, saving you time and effort.

Leverage the investor-ready format to confidently showcase your financial projections to banks, franchise representatives, or investors. Impress stakeholders with clear, data-driven insights and professional reports.

Leverage the investor-ready format to confidently present your projections to banks, franchise representatives, or investors.