
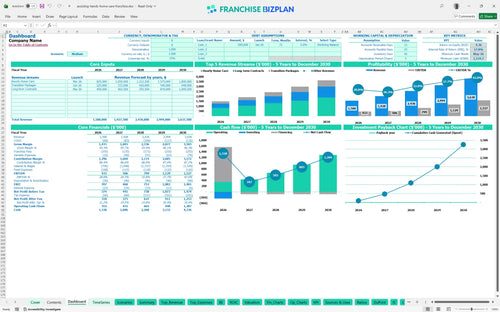
All-in-one Dashboard
Core inputs and core outputs


This comprehensive Excel spreadsheet for home care franchise unit financial planning includes detailed revenue drivers, a 60-month cash flow forecast, and a startup capital calculator tailored for premium senior care services.
Core inputs and core outputs
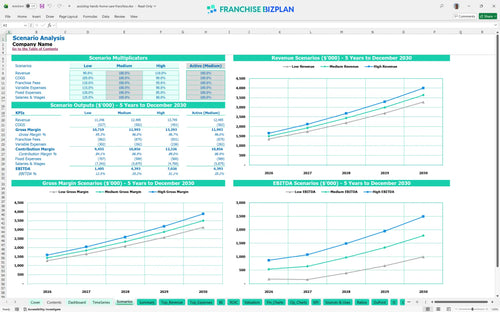
Three scenario analysis
Presentation ready
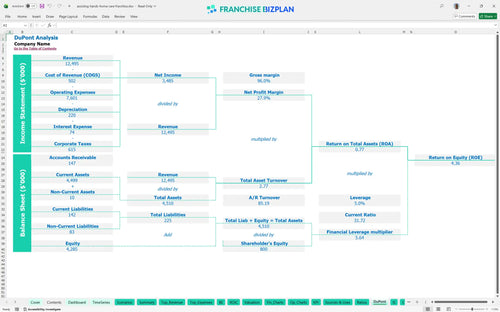
DuPont analysis
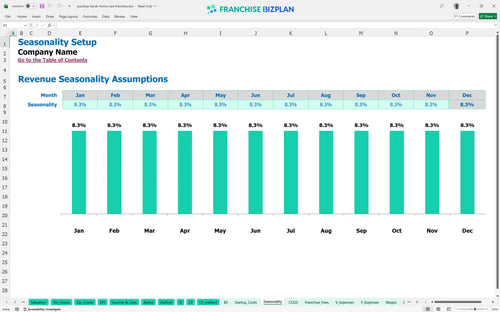
Researched revenue assumptions
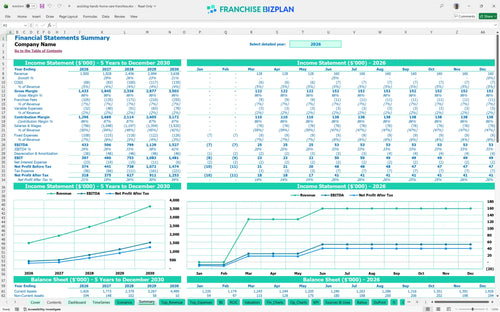
Lender-friendly financial outputs
Revenue stream detailed view
Performance metrics benchmark
We developed this home care agency business plan template using researched data to reflect the high-touch, concierge nature of premium senior services. The model comes pre-populated with key assumptions, including a $1.5M year-one revenue target and 15 initial home health aides, which you can defintely adjust based on your specific US territory or local labor market. It's a practical tool designed to help you move from a business idea to a fully funded, operational unit with confidence.
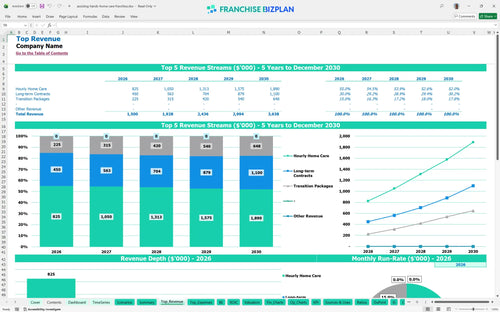
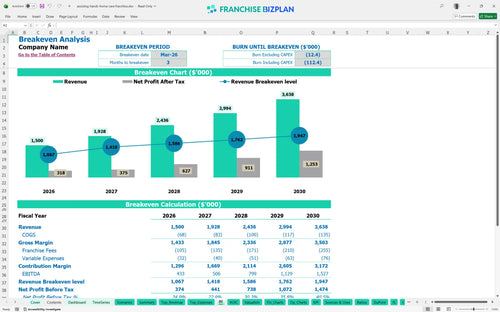
The model shows this unit reaching its break-even point in March 2026, just three months after the initial launch. With year-one EBITDA projected at $433,000, the business scales rapidly as you move from 15 to 27 full-time aides by year five. Here's the quick math: your profitability depends on maintaining a high volume of hourly home care, which is projected to grow from $550,000 to over $1.2M annually.
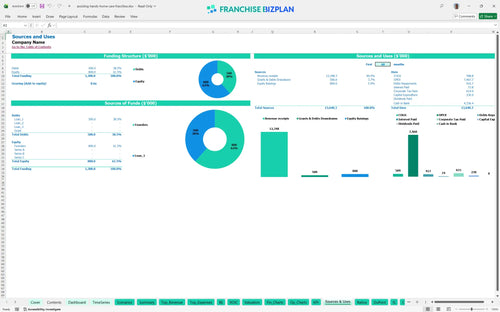
The total initial investment for this senior care franchise startup costs is approximately $230,000. This includes the $55,000 franchise fee, $50,000 for staff vehicles, and $45,000 for office leasehold improvements to meet brand standards. The model also accounts for $15,000 in launch marketing to ensure you hit the ground running with local referral sources and families.
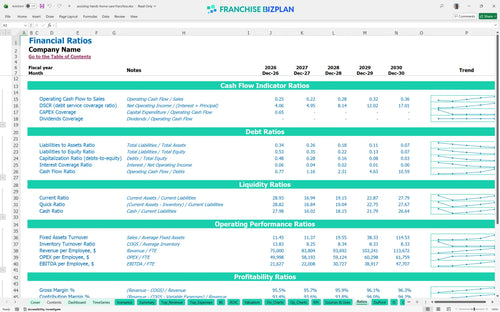
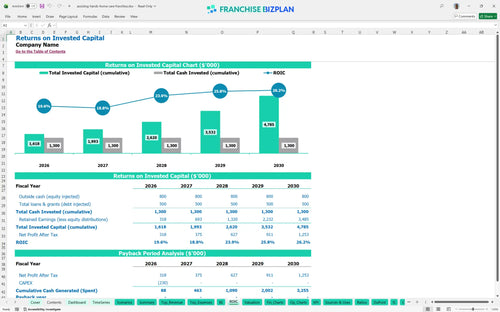
Investors can expect an Internal Rate of Return (IRR) of 16.97% and a Return on Equity (ROE) of 4.36. While the unit generates strong annual cash flow-reaching an EBITDA of $1.527M by year five-the total payback of the initial investment occurs after the fifth year. This estimate hides the fact that while monthly profits are high, the initial capital outlay and ramp-up costs require a long-term commitment to see a full return.
The monthly break-even point is reached in month 3, provided you can quickly deploy your initial 15 home health aides. The biggest driver for reaching this point is the volume of hourly care, which needs to offset the $5,500 monthly rent and the $25,416 monthly management payroll. If your recruitment of aides lags, your break-even date will slide right, increasing your need for working capital.
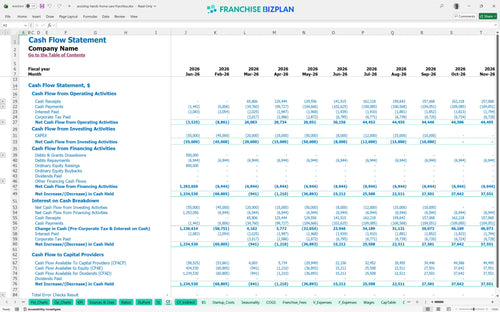
The lowest cash point for the operation occurs in May 2026, with a minimum cash requirement of $1,135,000. This high figure accounts for the significant working capital needed to float payroll for a large staff of aides before private-pay collections are fully realized. You need to ensure you have a sufficient cash buffer to handle the timing gap between paying your team and receiving client checks.
In a high-growth scenario, hitting $3.6M in revenue by year five is achievable if you maximize long-term contracts and maintain a 'caregiver-first' culture to keep turnover low. A low-growth scenario, where revenue stays closer to the year-one $1.5M mark, would significantly compress margins due to the high fixed cost of management salaries. Analyzing recurring revenue in a home care franchise model is the best way to ensure you stay on the high-growth trajectory.
This home care franchise financial model is built in Excel with fully editable assumptions, allowing you to stress-test your specific territory. You can adjust caregiver wages, billing rates, and territory-specific rent to see how they impact your bottom line. The pre-filled formulas handle the heavy lifting, so you can focus on local market dynamics rather than building a spreadsheet from scratch.

Planning for a premium senior care business requires a long-term view of how recurring revenue scales over time. This model provides 5-year revenue forecasts, starting at $1.5M in year one and climbing to $3.6M by year five as your referral network matures. It gives you a clear look at your pro forma financial statements for home care agency owners, ensuring you see the path from startup to a mature, multi-million dollar operation.

Operating within a franchise system means accounting for specific top-line deductions like the 5% royalty and 2% marketing fund. This franchise financial projection spreadsheet automatically calculates these fees against your projected revenue streams, such as hourly care and transition packages. Understanding these obligations is vital because they represent a permanent 7% margin gap that your local pricing must cover.

Knowing how to calculate startup costs for a home care franchise is the first step toward securing funding or committing personal capital. This model aggregates your $55,000 franchise fee, $50,000 for staff vehicles, and $45,000 in leasehold improvements to define your total entry price. It then maps these against your monthly fixed costs, like the $5,500 office rent, to pinpoint exactly when your monthly revenue covers every dollar of overhead.

This financial forecasting template for senior care business owners includes built-in benchmarks for labor and operating expenses. Since caregiver payroll is your largest expense, the model helps you track if your $32,000 average aide salary stays within a healthy percentage of your $55 average ticket. Comparing your expected performance against these private duty home care financial benchmarks keeps your plan grounded in reality.


Simply purchase and download the financial model template, then access it instantly using Microsoft Excel or Google Sheets. No installation or technical expertise required-just open and start working.

Enter your business-specific numbers, including revenue projections, costs, and investment details. The pre-built formulas will automatically calculate financial insights, saving you time and effort.

Leverage the investor-ready format to confidently showcase your financial projections to banks, franchise representatives, or investors. Impress stakeholders with clear, data-driven insights and professional reports.

Leverage the investor-ready format to confidently present your projections to banks, franchise representatives, or investors.