
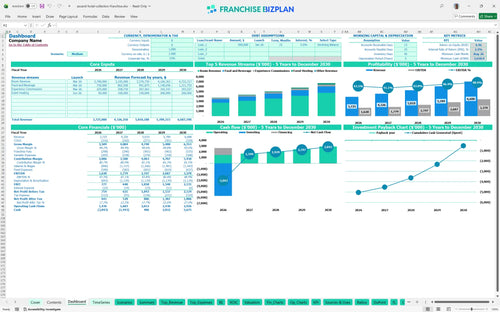
All-in-one Dashboard
Core inputs and core outputs


This boutique hotel business plan template provides a complete Excel-based toolkit for forecasting revenue, managing franchise fees, and calculating long-term ROI for a historic property conversion.
Core inputs and core outputs
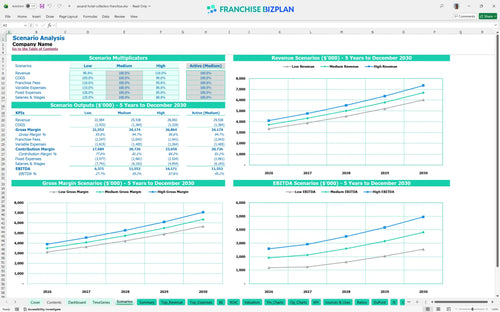
Three scenario analysis
Presentation ready
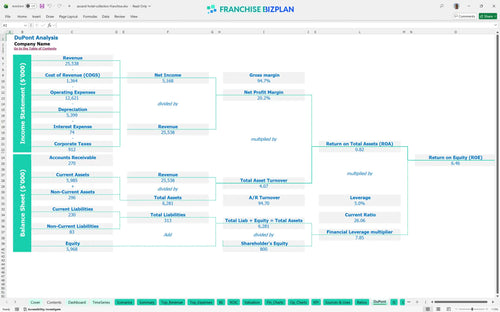
DuPont analysis
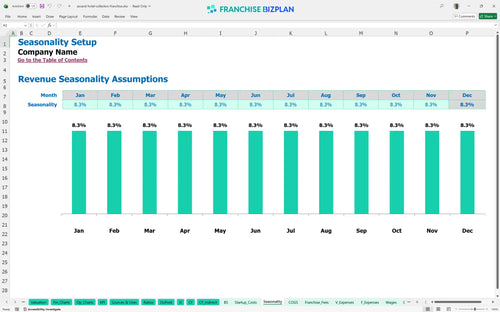
Researched revenue assumptions
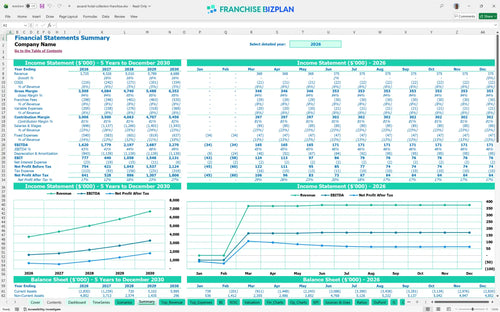
Lender-friendly financial outputs
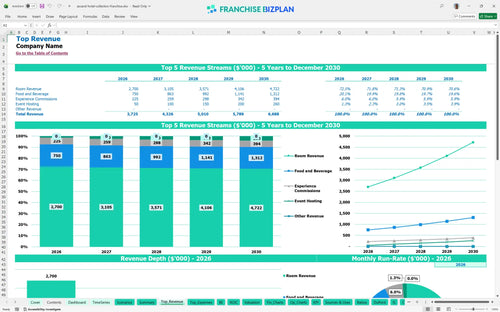
Revenue stream detailed view
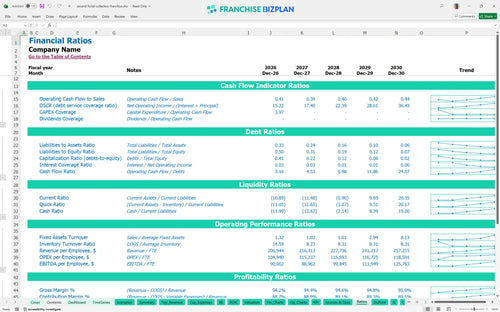
Performance metrics benchmark
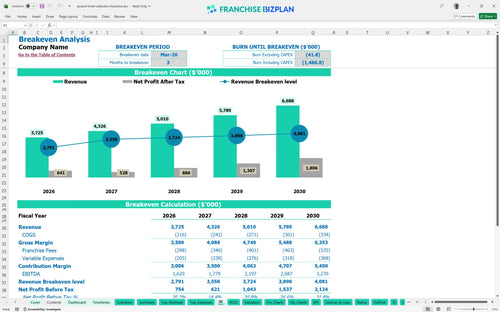
Based on the data, this unit hits its break-even point in March 2026, just three months after launch. While Year 1 EBITDA is strong at $1,620,000, the heavy initial investment means true payback occurs after year five. You will defintely need to maintain high occupancy to support the $25,000 monthly rent and 8% total franchise fee burden.
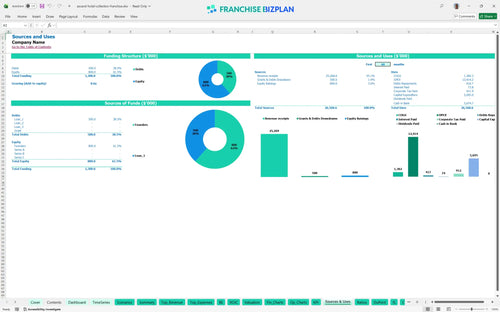
You need a total initial investment exceeding $5.7 million to launch this boutique concept in the US. This includes the $45,000 initial franchise fee and a massive $3.5 million combined for historic renovation and interior fit-out. The model also accounts for $1,000,000 in FFE procurement (Furniture, Fixtures, and Equipment) and $750,000 for kitchen and lounge equipment.
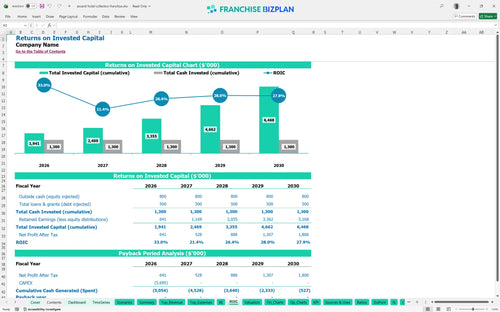
The internal rate of return (IRR) is projected at 2.22%, with a return on equity (ROE) of 6.46%. While these numbers reflect the capital-intensive nature of boutique hotel profitability analysis, the EBITDA margin grows to nearly 49% by year five. The payback period extends beyond five years, making this a long-term ROI analysis for independent hotel franchise conversion.
The unit reaches break-even in March 2026, requiring about three months of operation to cover its monthly fixed costs. Your biggest hurdle is the $47,200 in monthly fixed overhead, which includes rent, utilities, and property taxes. Revenue per available room (RevPAR) is the primary driver that will move the needle on this timeline faster than ancillary income.
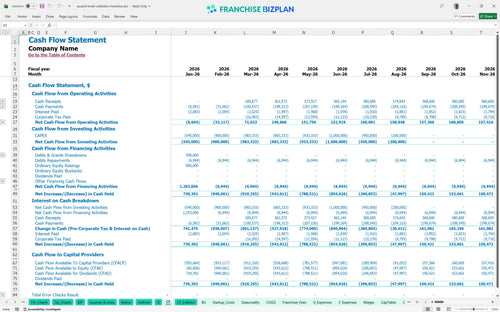
The lowest cash point hits in August 2026 at negative $3,651,000, primarily due to the timing of phased renovation and equipment payments. You need a significant capital reserve to bridge the gap between the construction phase and stabilized operations. Managing the $5.7 million in capital investment requirements for boutique hotel conversion is more vital than early-day sales for survival.
A high-performance scenario could push Year 1 revenue well past $4 million, significantly improving the 2.22% IRR and shortening the payback period. Conversely, a low scenario where occupancy lags could deepen the $3.6 million cash hole and delay break-even beyond the three-month mark. The model allows you to stress-test how a 10% drop in room rates impacts your hotel management pro forma.
We built this hotel franchise financial model based on real-world boutique hospitality data and historic conversion costs. Key assumptions like the $1.8 million initial room revenue and the $130,000 GM salary are pre-populated but fully editable. This ensures your hospitality industry financial projections are grounded in reality while remaining flexible for your specific site selection and local demand.
Finance: update unit break-even and payback model by Friday.
This hotel franchise financial model is built in Excel, allowing you to swap out assumptions for your specific market. All formulas are pre-filled, so you can adjust room rates or labor costs without breaking the logic. It is a flexible tool for testing different occupancy levels or renovation budgets to see how they impact your bottom line.

Map out your long-term vision with detailed annual projections for revenue and cash flow. The model tracks your progress from a $3.7 million start to over $6.6 million by year five. This helps multi-unit operators see how a single boutique unit fits into a larger portfolio over time while managing hospitality industry financial projections.

Operating a major brand requires precise tracking of ongoing obligations like the 5% royalty and 3% marketing fee. This model calculates these costs automatically based on your room revenue and food sales. You will see exactly how much goes to the brand before you cover your local property taxes and insurance in your franchise disclosure document review.

Launching a boutique hotel requires significant upfront capital, including a $1.5 million renovation and $2 million for interior design. This franchise startup cost calculator helps you determine the exact point where your monthly revenue covers these high fixed costs. Knowing your break-even point is critical for managing your early-stage cash runway and capital expenditure planning.

Compare your projected performance against hospitality industry standards for labor and occupancy. The model includes pre-set ranges for guest supplies and food costs to ensure your pro forma stays realistic. It is a sanity check to make sure your $130,000 GM salary and staffing levels align with franchise unit financial performance benchmarking for upscale boutique hotels.


Simply purchase and download the financial model template, then access it instantly using Microsoft Excel or Google Sheets. No installation or technical expertise required-just open and start working.

Enter your business-specific numbers, including revenue projections, costs, and investment details. The pre-built formulas will automatically calculate financial insights, saving you time and effort.

Leverage the investor-ready format to confidently showcase your financial projections to banks, franchise representatives, or investors. Impress stakeholders with clear, data-driven insights and professional reports.

Leverage the investor-ready format to confidently present your projections to banks, franchise representatives, or investors.