
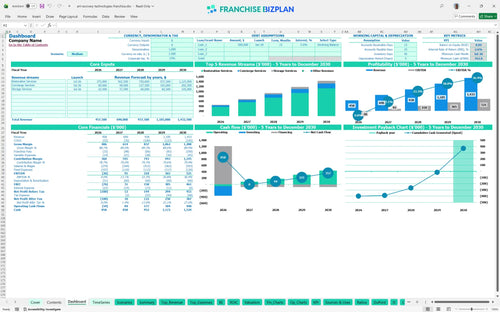
All-in-one Dashboard
Core inputs and core outputs


This product provides a comprehensive, data-driven financial toolkit designed to forecast the performance and capital needs of a single restoration service unit.
Core inputs and core outputs
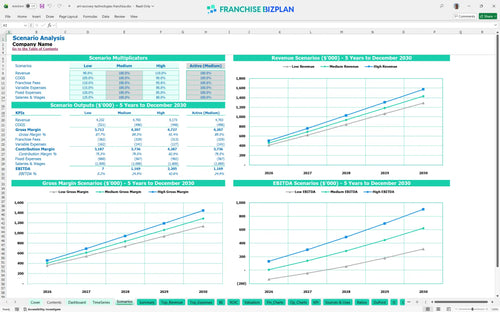
Three scenario analysis
Presentation ready
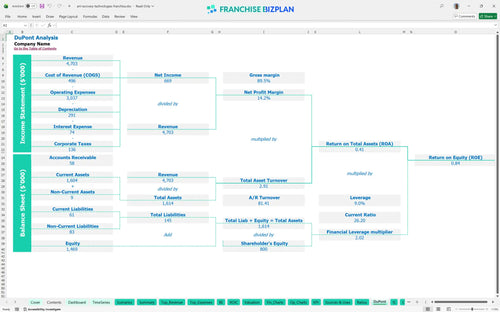
DuPont analysis
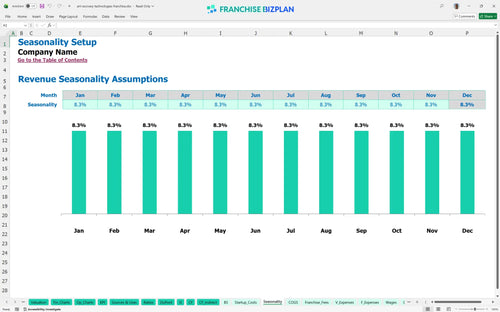
Researched revenue assumptions
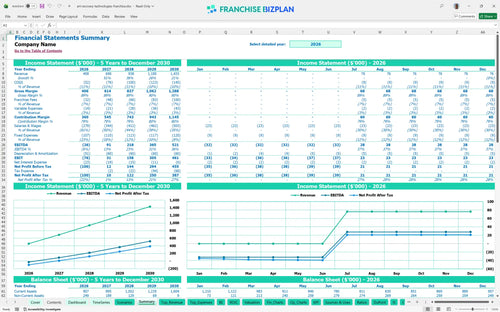
Lender-friendly financial outputs
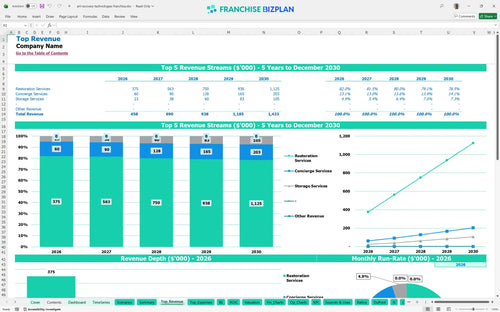
Revenue stream detailed view
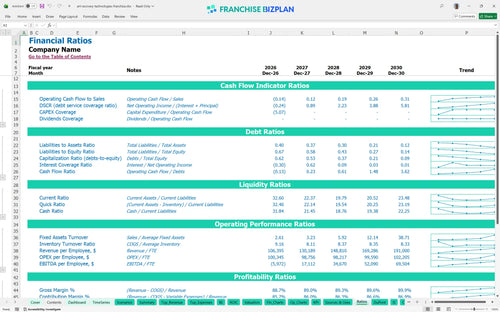
Performance metrics benchmark
We built this financial model using deep research into specialized restoration services and multi-unit economics. The pre-populated data includes a Year 1 revenue target of $458,000 and a 7% royalty structure, but you can defintely edit every cell to match your specific territory and local market demand.
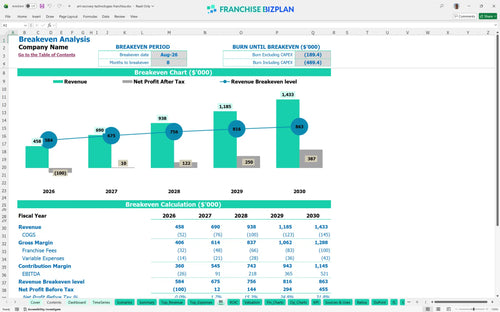
Restoration service franchise profitability usually hits its stride in the second year. While Year 1 shows a -$26,000 EBITDA during the ramp-up, Year 2 jumps to $91,000 in earnings as you move past the initial 8-month breakeven point in August 2026.
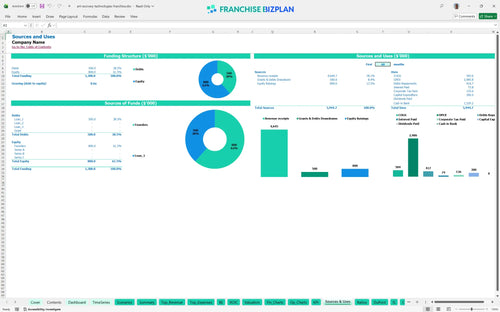
To get this unit off the ground, you will need approximately $300,000 in initial capital. This covers the $48,000 franchise fee, $80,000 in leasehold improvements for a secure facility, and $70,000 for specialized restoration equipment and climate-controlled transport.
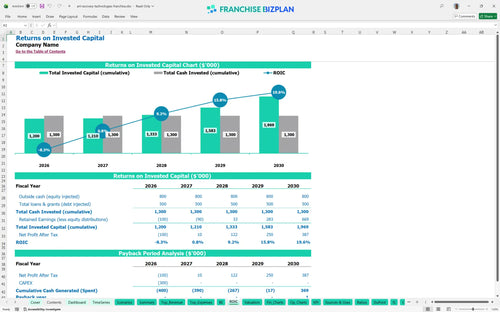
The model projects an Internal Rate of Return (IRR) of 2.57% with a 5-year payback period. While the initial return seems modest, the Year 5 EBITDA of $521,000 shows significant cash flow potential once the unit reaches maturity and stabilizes its local insurance referral network.
You need to reach break-even by August 2026, roughly 8 months after launch. The primary driver for this disaster recovery business model is covering $8,900 in monthly fixed costs, including $5,000 for a secure facility and $1,200 for specialized property insurance.
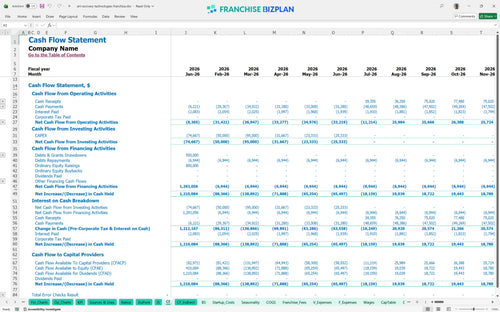
Your lowest cash point hits $762,000 in July 2026 as you finalize the facility build-out and hire your core team. Maintaining a solid buffer is vital to handle the timing gap often found in insurance claim mitigation revenue, where payouts can lag behind the actual restoration work.
In a high-growth scenario, hitting $1.43M in Year 5 revenue significantly boosts your store-level margin. This high-net-worth service franchise relies on high average tickets; a 10% drop in volume can delay your payback period past the 5-year mark, so local marketing execution is non-negotiable.
This franchise financial model template is built in Excel with fully editable assumptions and pre-filled formulas. You can adjust every driver from local labor rates to specific lease terms, making it easy to see how different operating scenarios impact your bottom line without needing to be a spreadsheet expert.

Plan for the long haul with a detailed franchise unit financial projection that covers five years of operations. This franchise business plan template maps out the transition from the initial ramp-up phase to a mature, high-volume unit, providing a clear view of your projected balance sheet and long-term cash flow.

Managing your franchise royalty and fee structure is critical for maintaining store-level margins. This model tracks the 7% royalty fee and initial investment obligations, ensuring you understand exactly how much revenue goes to the franchisor and how much stays in your pocket after all brand-specific costs are settled.

Launching a specialized art preservation business requires significant upfront capital for climate-controlled environments and expert tools. Our model breaks down these startup costs and calculates the exact sales volume you need to cover your fixed monthly expenses, helping you manage risk during the critical early months.

We include built-in industry benchmarks so you can compare your projected labor and occupancy costs against typical restoration standards. This helps you sanity-check your numbers and ensures your rent-to-revenue and payroll-to-sales ratios remain within a healthy range for a service-based franchise model.


Simply purchase and download the financial model template, then access it instantly using Microsoft Excel or Google Sheets. No installation or technical expertise required-just open and start working.

Enter your business-specific numbers, including revenue projections, costs, and investment details. The pre-built formulas will automatically calculate financial insights, saving you time and effort.

Leverage the investor-ready format to confidently showcase your financial projections to banks, franchise representatives, or investors. Impress stakeholders with clear, data-driven insights and professional reports.

Leverage the investor-ready format to confidently present your projections to banks, franchise representatives, or investors.