
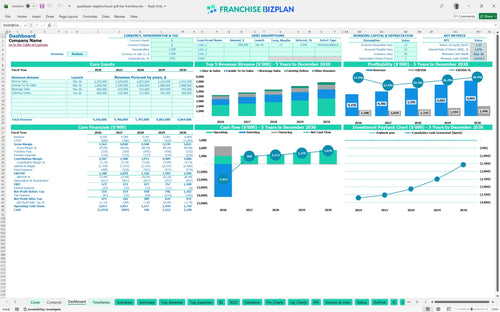
All-in-one Dashboard
Core inputs and core outputs


This franchise startup cost template provides a complete financial roadmap from the initial $35,000 fee to five years of operational cash flow data.
Core inputs and core outputs
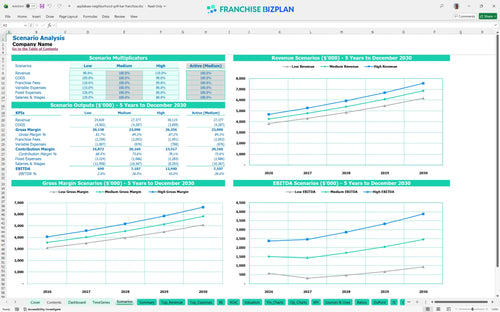
Three scenario analysis
Presentation ready
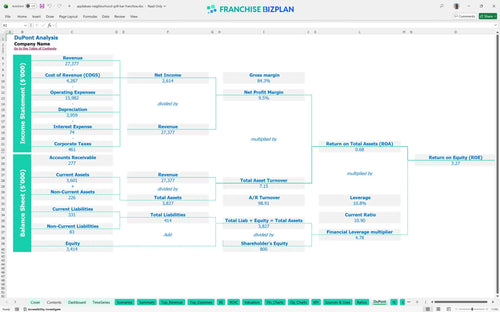
DuPont analysis
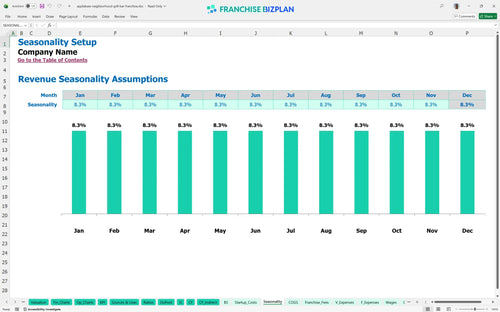
Researched revenue assumptions
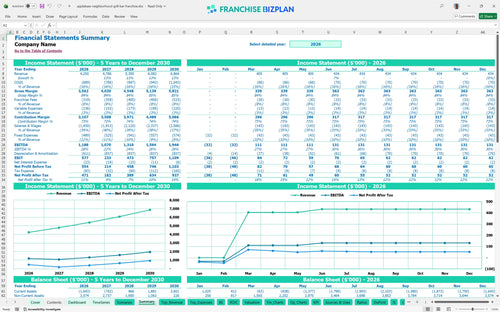
Lender-friendly financial outputs
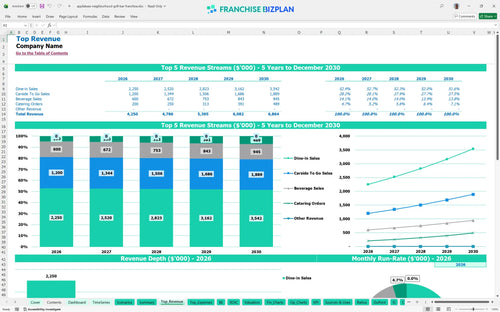
Revenue stream detailed view
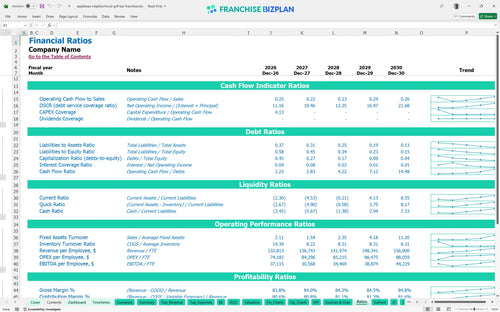
Performance metrics benchmark
We built this restaurant financial forecasting template using our own research into high-volume casual dining units. Key assumptions like the $1.8 million leasehold improvements and 7.5% combined franchise fees are pre-populated and fully editable. Developing a financial model for a community-integrated restaurant requires this level of detail to ensure the $1.18 million year-one EBITDA is actually achievable.
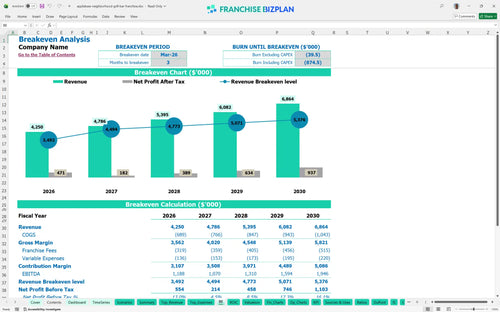
The model shows this unit reaching its monthly break-even point by March 2026, just three months after the doors open. We calculate this by weighing the $4.25 million opening year revenue against heavy fixed costs and an EBITDA calculation for restaurants that accounts for 14% food costs. Still, the high initial investment means you are playing a long game for true bottom-line returns.
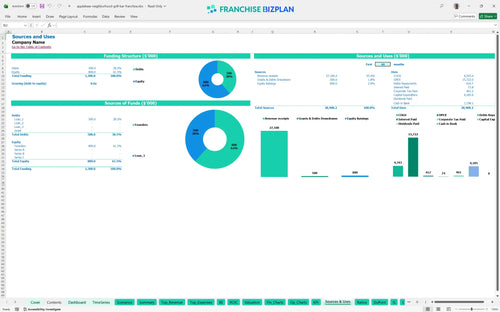
You need a total initial investment of $4,185,000 to launch this unit, covering everything from the $35,000 franchise fee to the $700,000 kitchen package. The largest chunk of your capital expenditure budget goes toward $1.8 million in leasehold improvements to meet the brand's neighborhood grill standards. Plus, you need to account for the $400,000 bar setup and $350,000 carside infrastructure.
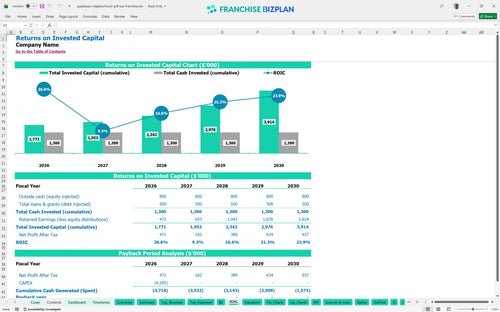
This is a high-volume, capital-intensive play with a payback period that defintely extends beyond the first five years of operation. Using the restaurant franchise ROI and profit margin calculator, we see an internal rate of return (IRR) of 1.6% and a return on equity (ROE) of 3.27%. While EBITDA grows to $1.94 million by year five, the initial $4.1 million outlay dictates the pace of your return.
Your monthly break-even revenue must cover $28,000 in rent and over $30,000 in monthly management salaries before you see a dime of profit. This franchise investment feasibility study template identifies that volume is your biggest lever, especially with fixed utilities at $7,500. To reach the March 2026 break-even date, your dine-in and carside channels must hit their stride immediately.
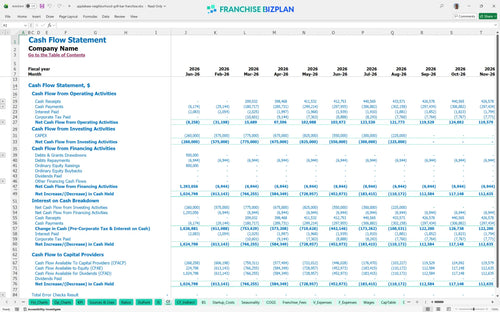
The lowest cash point occurs in August 2026 at negative $2.414 million, highlighting the massive capital gap during the build-out and ramp-up phase. You will need an Excel template for restaurant franchise cash flow forecasting to manage this dip and ensure you have enough liquidity to cover the $150,000 in opening supplies. Honestly, a cash buffer is mandatory here.
Using a franchise unit profitability analysis, we see how a 10% swing in revenue affects your ability to service the $4.1 million investment. A financial model for high-volume takeout and delivery service shows that carside sales can protect your margin if dine-in traffic slows. But if food costs creep up by even 2 points, your year-one EBITDA takes a significant hit.
Finance: update unit break-even and payback model by Friday
This restaurant franchise financial model is built in Excel with open formulas, so you can tweak every assumption to fit your specific territory. Whether you are adjusting the carside to go sales or local labor rates, the logic stays intact. It is one of the best financial planning tools for restaurant franchise owners who need to move beyond back-of-the-napkin math.

Map out your casual dining franchise business plan with a full five-year outlook that tracks growth from an initial $4.25 million in sales. The model scales with your operation, showing how revenue can climb toward $6.8 million as your neighborhood presence matures. Honestly, seeing the long-term EBITDA trend is the only way to justify a multi-million dollar build-out.

This tool tracks the 4% royalty fee and 3.5% marketing fund contribution automatically across all revenue streams. Analyzing franchise royalty and advertising fund costs ensures you see the true store-level margin after the franchisor takes their cut. We include franchise royalty fee projections so there are no surprises when the monthly ACH withdrawal hits your bank account.

Estimating break-even point for a new restaurant franchise is critical when your total capital expenditure budget hits $4.18 million. The model includes a commercial real estate lease analysis to handle the $28,000 monthly rent. Here's the quick math: you need to know exactly how to calculate startup costs for a casual dining restaurant before signing a personal guarantee.

Use our restaurant franchise unit economic performance metrics to see if your 14% food cost assumption is too aggressive. We include restaurant labor cost management benchmarks to help you right-size a team that includes 14 servers and 9 line cooks. Comparing your projected gross margins against industry standards helps you spot potential margin leaks before you open the doors.


Simply purchase and download the financial model template, then access it instantly using Microsoft Excel or Google Sheets. No installation or technical expertise required-just open and start working.

Enter your business-specific numbers, including revenue projections, costs, and investment details. The pre-built formulas will automatically calculate financial insights, saving you time and effort.

Leverage the investor-ready format to confidently showcase your financial projections to banks, franchise representatives, or investors. Impress stakeholders with clear, data-driven insights and professional reports.

Leverage the investor-ready format to confidently present your projections to banks, franchise representatives, or investors.