
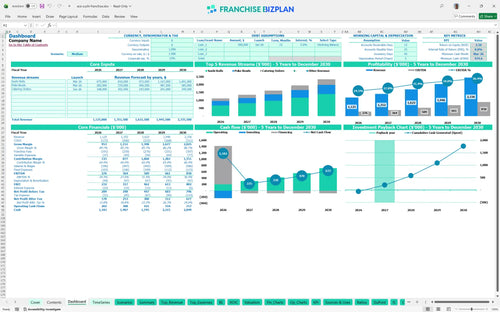
All-in-one Dashboard
Core inputs and core outputs


This sushi franchise financial model provides a complete toolkit for calculating startup costs, forecasting five years of profits, and analyzing unit economics for a retail food kiosk.
Core inputs and core outputs
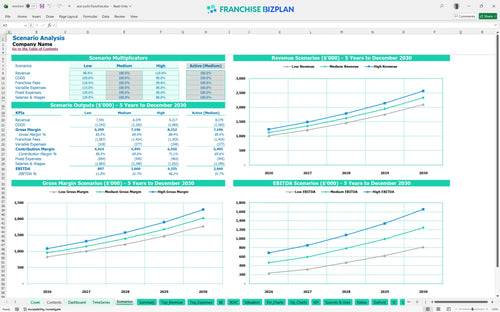
Three scenario analysis
Presentation ready
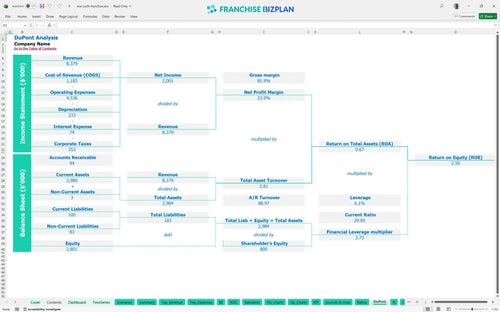
DuPont analysis
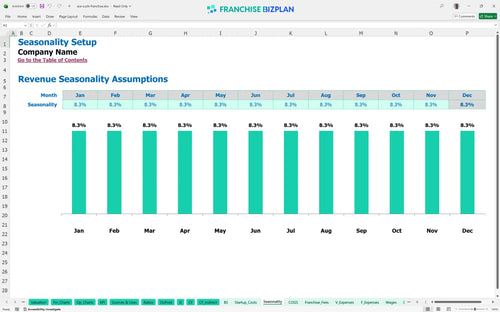
Researched revenue assumptions
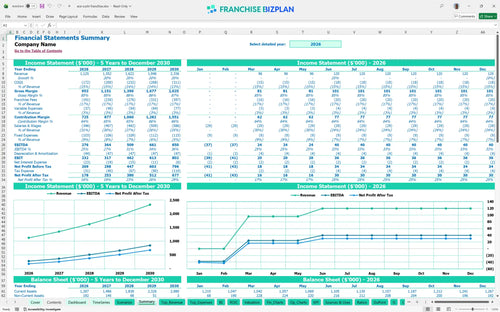
Lender-friendly financial outputs
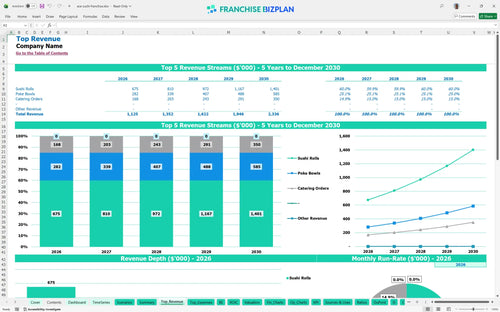
Revenue stream detailed view
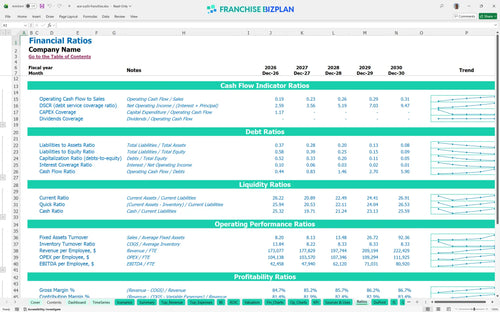
Performance metrics benchmark
We built this Ace Sushi Franchise franchise unit financial model using our own research to ensure it reflects actual market conditions. Key assumptions like the $1.125M year-one revenue and the 15% royalty fee are pre-populated but fully editable, allowing you to stress-test your sushi franchise investment return calculator. This data-driven approach helps you move from a general food kiosk profitability analysis to a concrete execution plan for your specific location.
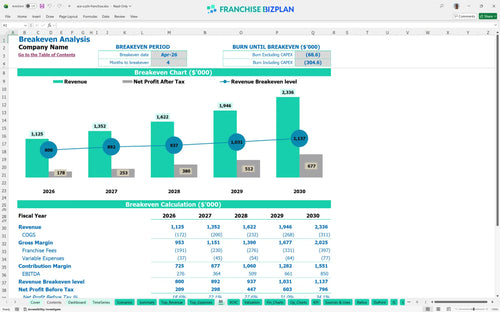
You can expect this unit to hit its break-even date by April 2026, just four months after launching. With a Year 1 EBITDA of $276,000, the model shows a clear path to scaling as catering orders ramp up and seafood costs drop from 13.5% to 11.5% over five years.
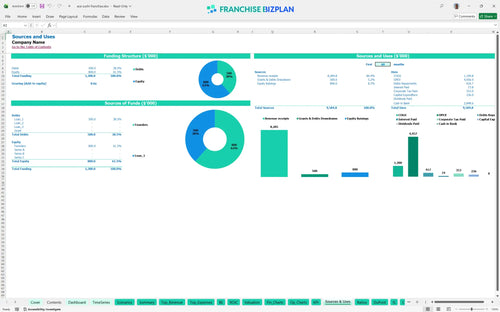
Total franchise startup capital for this unit is approximately $236,000, covering everything from the $6,000 franchise fee to the $110,000 build-out. You will also need to account for the $45,000 display cases and $25,000 in prep equipment before your first roll is sold.
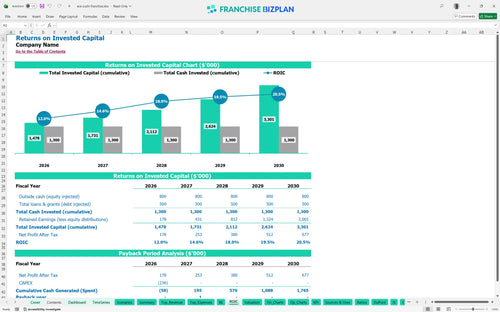
Investors can look forward to an IRR of 8.85% and a full payback on the initial investment within two years. The ROE of 2.5 indicates a solid performance for a retail food kiosk business model in a high-traffic urban setting, making it a competitive financial projection spreadsheet for retail food franchise owners.
The unit reaches break-even in month four, needing to cover roughly $8,550 in monthly fixed costs including rent, insurance, and tech fees. The biggest driver for hitting this goal is the volume of sushi rolls, which are projected to bring in $450,000 in the first year alone.
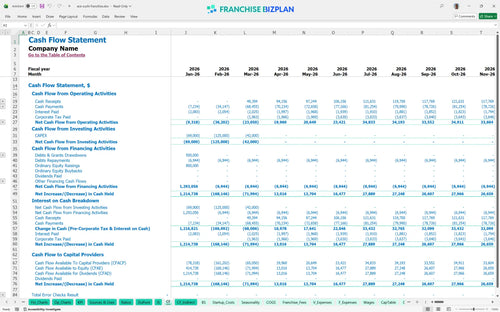
Your lowest cash point is projected at $975,000 in March 2026, immediately following the heavy CAPEX phase for equipment and build-out. While the model shows a quick recovery, maintaining a buffer is vital to handle potential delays in the kiosk construction or startup budget for sushi retail unit overruns.
Moving from a medium to a high-revenue scenario significantly shortens your payback period and boosts your Year 5 EBITDA toward the $850,000 mark. Conversely, a low-revenue scenario might extend the break-even date past April 2026, making operational overhead management even more critical to survival.
This franchise financial model lives in Excel, giving you total control over the variables that dictate your bottom line. You can swap out seafood costs, adjust labor hours for your sushi chefs, or change rent figures to match your specific lease. Since every market reacts differently, having editable assumptions means you aren't stuck with a static guess when building your restaurant franchise business plan.

Multi-unit operators need to see the long game, and this model provides a clear 60-month roadmap for revenue and cash flow. We project annual sales climbing from $1.125M in year one to over $2.3M by year five, accounting for scaling catering operations and organic growth. It maps out your balance sheet and net income so you can anticipate when to reinvest or pull profit from your sushi franchise costs.

Royalties and brand fees are the tax on your top line that can squeeze margins if you aren't careful. This tool bakes in the 15% royalty and 2% marketing fund contribution automatically, showing you exactly how much goes back to the franchisor from your $450,000 in annual sushi roll sales. Understanding these fixed percentages helps you set the right menu prices in your franchise profit and loss template to maintain a healthy store-level margin.

Launching a retail food kiosk business model requires significant upfront capital, from the $110,000 leasehold improvements to the $45,000 refrigerated display cases. This analysis calculates your total initial investment and identifies the exact sales volume needed to cover your $5,500 monthly rent and $1,100 utilities. Knowing your break-even point helps you manage the stress of those first few months of operation and understand how to calculate franchise startup costs accurately.

Don't fly blind when estimating what your lead sushi chef or crew members should cost. Our model includes benchmarks for labor and COGS (cost of goods sold-the direct cost of ingredients and packaging) to ensure your 13.5% seafood spend is realistic for a high-volume kiosk. Comparing your projected performance against these standards helps identify if your staffing plan is too heavy or your waste is too high during your unit economics review.


Simply purchase and download the financial model template, then access it instantly using Microsoft Excel or Google Sheets. No installation or technical expertise required-just open and start working.

Enter your business-specific numbers, including revenue projections, costs, and investment details. The pre-built formulas will automatically calculate financial insights, saving you time and effort.

Leverage the investor-ready format to confidently showcase your financial projections to banks, franchise representatives, or investors. Impress stakeholders with clear, data-driven insights and professional reports.

Leverage the investor-ready format to confidently present your projections to banks, franchise representatives, or investors.