
All-in-one Dashboard
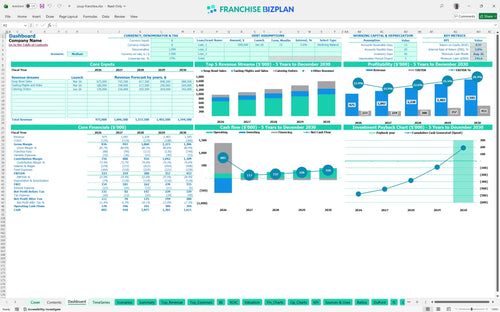
Core inputs and core outputs


This comprehensive toolkit provides everything a prospective owner needs to evaluate the financial viability and long-term growth potential of a soup-focused franchise unit.
Core inputs and core outputs
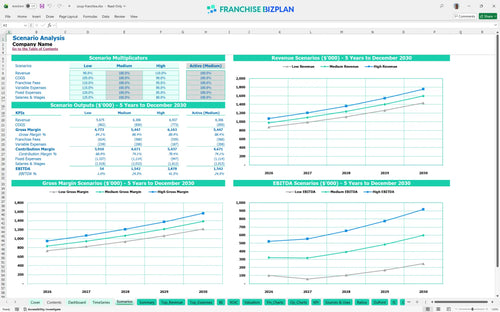
Three scenario analysis
Presentation ready
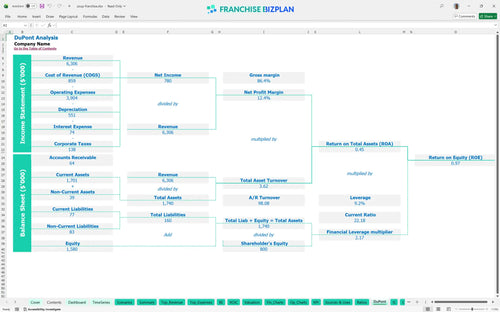
DuPont analysis
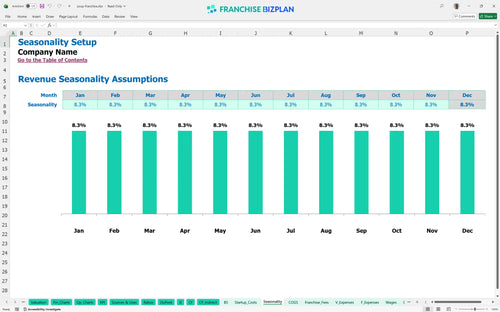
Researched revenue assumptions
Lender-friendly financial outputs
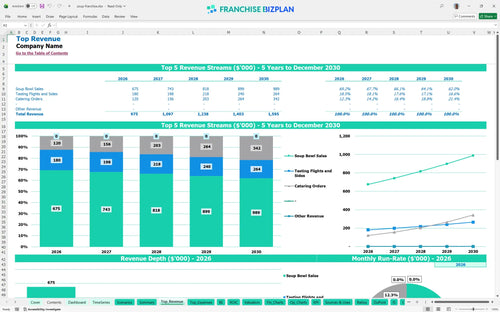
Revenue stream detailed view
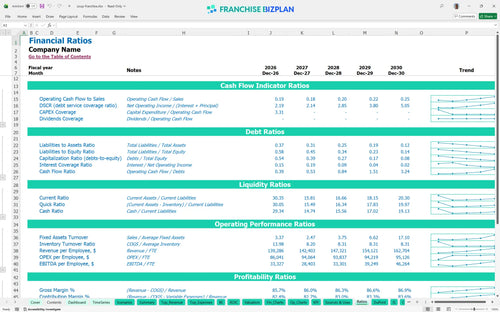
Performance metrics benchmark
We built this model using deep research into fast-casual soup concepts to ensure your financial planning for new franchise owners is accurate. The assumptions for revenue streams like soup bowls and catering, plus operating expenses like the $65,000 manager salary, are pre-populated and ready for your input. With a year-one EBITDA of $233,000 already modeled, you can defintely start your analysis with a high-fidelity baseline.
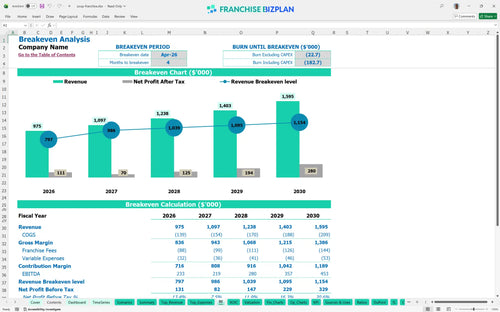
This franchise unit hits its stride quickly, reaching the break-even point in just 4 months by April 2026. After accounting for food costs, the 9% total franchise fees, and a $12,000 monthly rent, the model shows a steady climb in net profit through year five. Efficiency in prep labor and catering growth are the primary drivers for this trajectory.
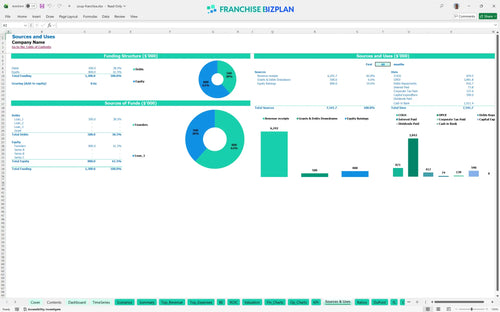
You will need approximately $590,000 in total CAPEX to get the doors open in a prime US market. This covers the $35,000 franchise fee, $280,000 for leasehold improvements, and $130,000 for kitchen equipment. The model also accounts for a minimum cash requirement of $746,000 to ensure you have enough runway during the initial ramp-up phase.
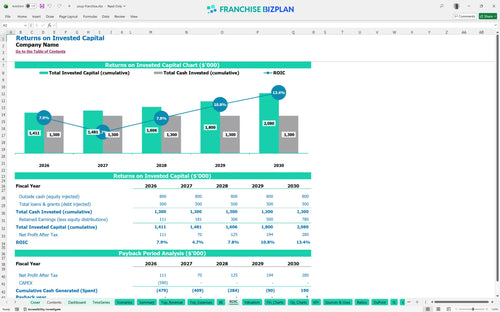
The model projects an Internal Rate of Return (IRR) of 3.04% and a Return on Equity (ROE) of 0.97 over the initial five-year period. While the years to payback is estimated at 5 years, the steady increase in EBITDA from $233,000 to $453,000 shows strong long-term value. This is a marathon, not a sprint, where mature unit performance carries the weight.
The monthly break-even point is reached in April 2026, just four months after the January launch. This fast start depends heavily on managing the $12,000 monthly rent and the $187,000 annual management payroll. Because soup has a high contribution margin, volume is your best friend for covering these fixed costs early.
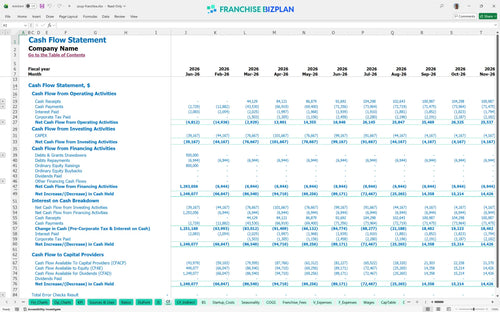
The lowest cash point occurs in August 2026, with a minimum cash balance of $746,000. This suggests you need a healthy buffer to handle the timing gaps between leasehold spending and the catering revenue ramp-up. We recommend keeping at least three months of operating expenses in reserve to handle any unexpected dips in foot traffic.
In a high-revenue scenario, year-one sales exceeding $975,000 can pull the payback period forward by several months. Conversely, a low-volume scenario makes the $14,400 in monthly insurance and utilities feel much heavier. The model allows you to stress-test how to calculate franchise unit profitability if labor costs spike or catering demand lags.
This franchise financial model template is built in Excel to give you total control over your numbers. You can adjust pre-filled formulas and editable assumptions to match your specific territory, whether you are looking at a high-traffic corner unit or a smaller footprint. It is a flexible tool designed to handle the unique variables of a fast-casual restaurant financial model excel without needing a degree in finance.

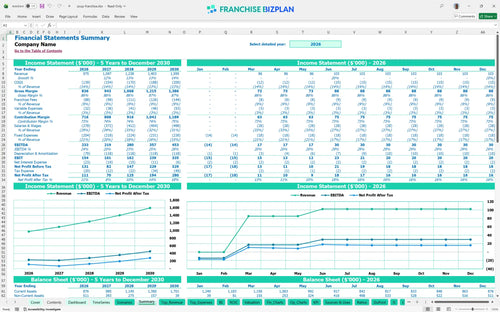
Building a restaurant franchise business plan requires a long-term view of how your cash moves over time. This model delivers a full 5-year outlook on revenue, costs, and profit, helping you see the transition from a new opening to a mature unit. You get a clear profit and loss statement that tracks your growth from $975,000 in year one to over $1.5 million by year five.

The franchise unit economic model is designed to track every dollar that leaves the store for the home office. It specifically calculates the 6% royalty and 3% marketing fund contributions against your soup bowl and catering sales. Understanding these ongoing franchise unit operating cost analysis items is vital to knowing your true store-level margin before you pay yourself.

Launching a new location involves significant upfront capital, and this franchise startup cost spreadsheet maps out every penny. From the $35,000 initial fee to the $280,000 leasehold improvements, you can see exactly how much you need to raise. The model then calculates the break-even point calculation to show you the exact revenue needed to stop the bleed.

This restaurant financial projection template uses researched data to ensure your projections stay grounded in reality. We include benchmarks for food ingredients, which start at 12.5% of sales, and prime location rent at $12,000 per month. These guardrails help you perform a realistic franchise ROI analysis and avoid overly optimistic forecasting that ignores the reality of unit economics.


Simply purchase and download the financial model template, then access it instantly using Microsoft Excel or Google Sheets. No installation or technical expertise required-just open and start working.

Enter your business-specific numbers, including revenue projections, costs, and investment details. The pre-built formulas will automatically calculate financial insights, saving you time and effort.

Leverage the investor-ready format to confidently showcase your financial projections to banks, franchise representatives, or investors. Impress stakeholders with clear, data-driven insights and professional reports.

Leverage the investor-ready format to confidently present your projections to banks, franchise representatives, or investors.