
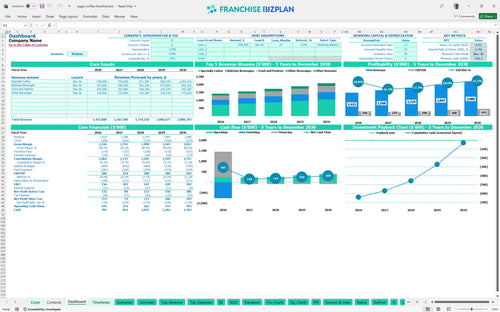
All-in-one Dashboard
Core inputs and core outputs


This comprehensive template includes a full P&L, cash flow tracker, and CAPEX schedule designed for a high-volume drive-thru coffee unit.
Core inputs and core outputs
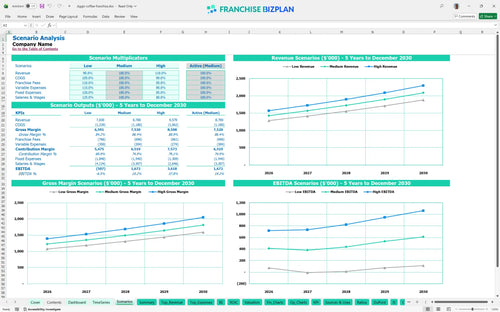
Three scenario analysis
Presentation ready
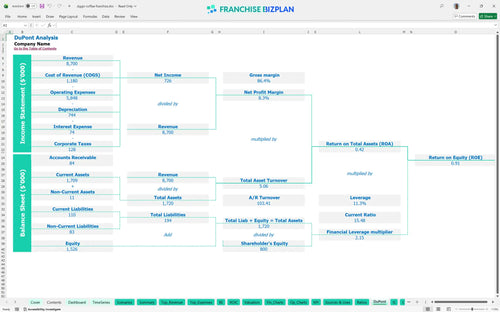
DuPont analysis
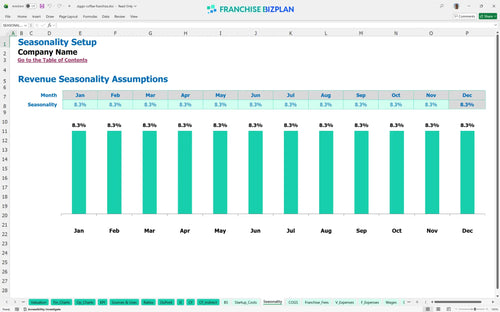
Researched revenue assumptions
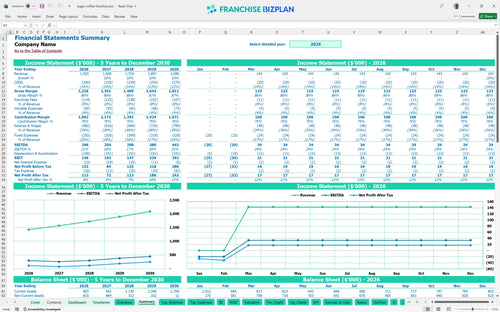
Lender-friendly financial outputs
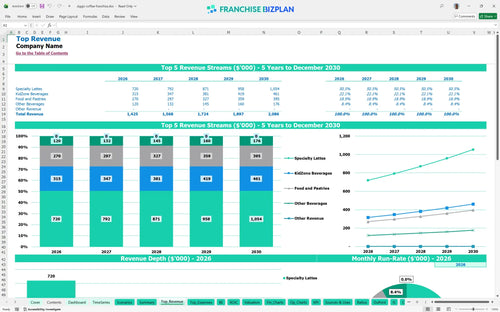
Revenue stream detailed view
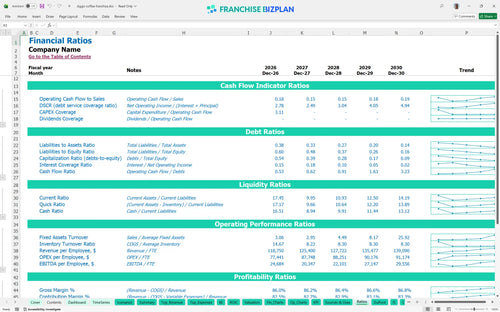
Performance metrics benchmark
We built this coffee franchise financial model using detailed research on high-volume drive-thru operations to give you a realistic roadmap. Key assumptions like the $1,425,000 Year 1 revenue and $18,000 monthly rent are pre-loaded but fully editable to fit your specific site. This tool ensures you understand the impact of the 6% royalty and 2% marketing fee on your monthly cash flow.
This unit reaches operational profitability by March 2026, just three months after launch. While EBITDA starts strong at $296,000 in Year 1, the model shows a slight dip in Year 2 to $254,000 before climbing steadily to $443,000 by Year 5. Success depends on maintaining the 11.5% COGS (cost of goods sold) target as volume grows.
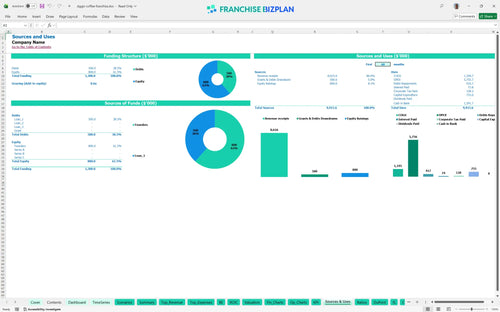
You need approximately $755,000 to get the doors open, covering everything from the $40,000 franchise fee to the $120,000 drive-thru infrastructure. The model assumes you maintain a $519,000 cash floor to handle the ramp-up phase safely through the lowest cash point in March 2026. Capital allocation is heavily weighted toward leasehold improvements and high-end espresso equipment.
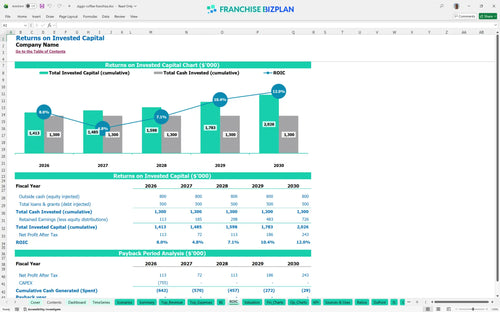
The model projects an IRR (Internal Rate of Return) of 2.31% and a Return on Equity of 0.91. While the unit generates healthy annual EBITDA, the high initial build-out costs mean full payback occurs after the fifth year of operation. Investors should focus on the long-term equity value as Year 5 revenue surpasses $2,000,000.
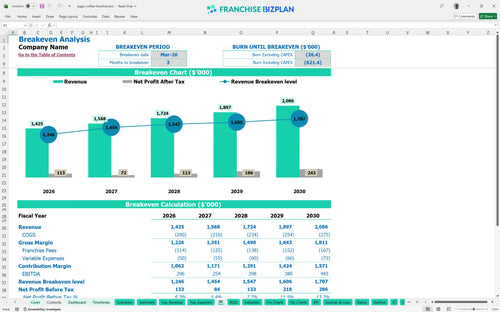
You hit the break-even point in March 2026, needing to cover about $24,300 in monthly fixed costs including rent, utilities, and insurance. Throughput is the biggest driver here; you need high vehicle counts to offset the $18,000 monthly rent. Every 1-point margin leak in COGS or labor will delay this milestone.
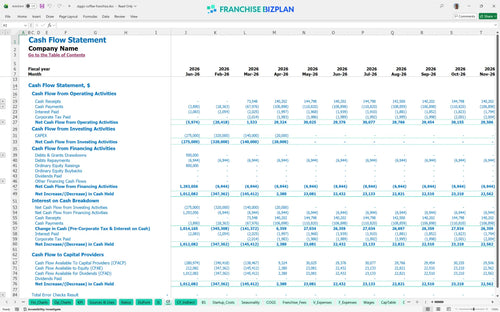
The lowest cash point occurs in March 2026 at $519,000, which includes your initial working capital buffer. If construction takes 60 days longer than planned, you will need to dip further into your reserves to cover the $18,000 monthly rent. Monitoring the timing between opening costs and mature-unit performance is vital for survival.
Switching between Low, Medium, and High scenarios adjusts your $1,425,000 Year 1 revenue and impacts your Year 5 EBITDA of $443,000. High-performance scenarios significantly shorten the payback period by maximizing the 11.5% ingredient cost efficiency. A 10% drop in traffic can turn a profitable month into a cash drain quickly.
Finance: update unit break-even and payback model by Friday.
This Excel-based tool allows you to swap every variable to match your specific territory and site. You can adjust the $18,000 monthly rent or the 6% royalty fee to see how they impact your bottom line instantly. The model is built for flexibility, so you can test different staffing levels or pricing for specialty lattes without breaking the formulas.

Plan for the long haul with detailed forecasts that track growth from $1,425,000 in Year 1 to over $2,086,000 by Year 5. This model accounts for scaling labor and cost of goods sold (COGS) as your volume increases. It provides a clear view of store-level EBITDA (earnings before interest, taxes, depreciation, and amortization) across a sixty-month horizon.

Managing the 8% total brand burden is critical for store-level margin. This model tracks the 6% royalty and 2% marketing fund contributions against your gross sales so you know exactly what stays in your pocket. It also accounts for the initial $40,000 franchise fee to ensure your startup capital is allocated correctly from day one.

Total initial investment hits roughly $755,000 when you include the $350,000 leasehold improvements and $110,000 in equipment. You need to know exactly when the daily beverage sales cover the $18,000 rent and payroll. This analysis helps you estimate the exact sales level required to stop burning cash and start generating a surplus.

We defintely included coffee-specific benchmarks like 11.5% ingredient costs and 2.5% for cups and packaging. These numbers help you sanity-check your assumptions and compare your expected performance against typical industry ranges. If your labor runs higher than the model's projections, you can quickly identify where to tighten the schedule.


Simply purchase and download the financial model template, then access it instantly using Microsoft Excel or Google Sheets. No installation or technical expertise required-just open and start working.

Enter your business-specific numbers, including revenue projections, costs, and investment details. The pre-built formulas will automatically calculate financial insights, saving you time and effort.

Leverage the investor-ready format to confidently showcase your financial projections to banks, franchise representatives, or investors. Impress stakeholders with clear, data-driven insights and professional reports.

Leverage the investor-ready format to confidently present your projections to banks, franchise representatives, or investors.