
All-in-one Dashboard
Core inputs and core outputs


This franchise financial model template provides a complete Excel-based toolkit for forecasting the growth and profitability of an automotive service location.
Core inputs and core outputs
Three scenario analysis
Presentation ready
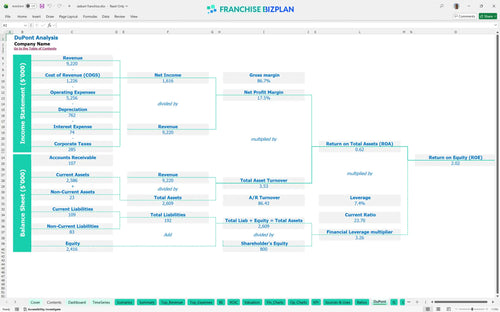
DuPont analysis
Researched revenue assumptions
Lender-friendly financial outputs
Revenue stream detailed view
Performance metrics benchmark
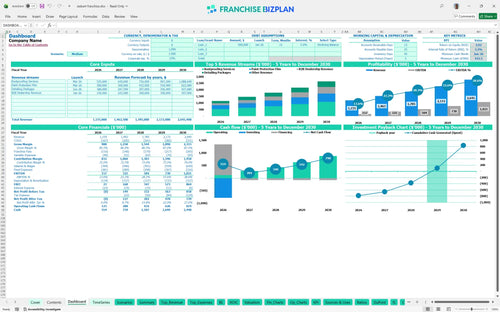
We built this profit and loss template for automotive service franchise units using detailed research into the vehicle protection industry. Key assumptions like the $1,155,000 year-one revenue and the 8% royalty fee are pre-populated and fully editable to fit your specific territory. This automotive franchise unit economic analysis tool helps you see how $157,000 in year-one EBITDA scales as you grow your technician count.
This franchise profitability analysis shows the unit hitting profitability quickly, with a year-one EBITDA of $157,000. By year five, net profit scales significantly to $1,021,000 as you optimize labor and chemical COGS, which defintely improves margins over time as you reach mature-unit performance.
Your capital expenditure budget for this auto detailing franchise investment totals approximately $785,000. This covers everything from the $45,000 initial fee to the $300,000 leasehold improvements and specialized rustproofing spray booths needed to start operations in a high-traffic automotive corridor.
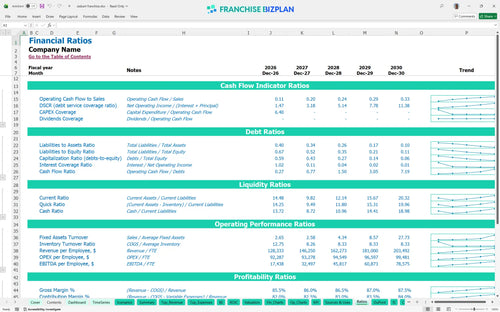
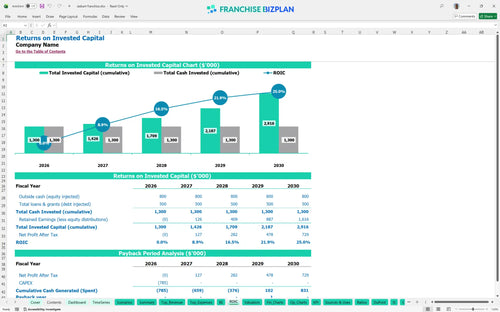
Financial planning for prospective franchise owners reveals an Internal Rate of Return (IRR) of 3.23% and a Return on Equity (ROE) of 2.02. The model estimates a 4-year payback period, meaning you recover your initial $785,000 investment through accumulated cash flow by the end of the fourth year of projecktions.
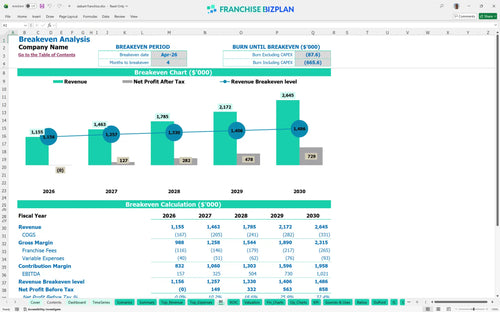
The break-even point occurs in April 2026, just 4 months after launch, according to the model. This rapid timeline depends on hitting your $15,000 monthly rent target and managing a labor force of 9 initial employees effectively to cover the $23,900 in monthly fixed operating expenses.
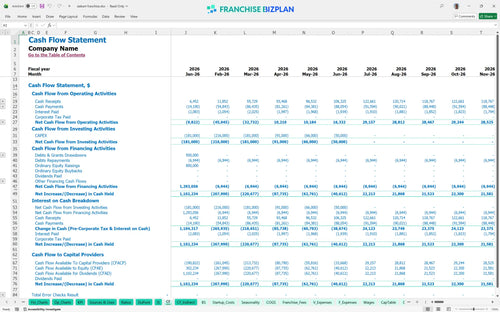
The lowest cash point is $422,000, occurring in June 2026. This means you need a solid cash buffer to handle the timing gap between your $785,000 startup spend and the estimating recurring revenue for car detailing franchise services that builds over the first six months of operation.
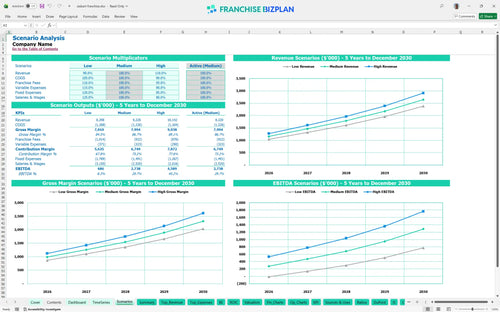
When learning how to build a financial model for an automotive franchise, you must test Low, Medium, and High scenarios. A 10% drop in B2B dealership revenue or a spike in chemical costs can delay your 4-year payback, while hitting the High case accelerates EBITDA growth beyond the $1,021,000 year-five forecast.
Finance: update unit break-even and payback model by Friday
This franchise financial forecasting template for beginners is fully customizable in Excel, featuring pre-filled formulas and editable assumptions that allow you to adapt the model to any specific territory or local market conditions. You can easily adjust the $15,000 monthly rent or shift the launch dates for services like rustproofing to see how timing impacts your first-year cash flow.

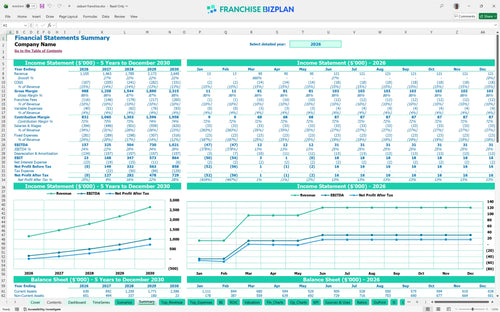
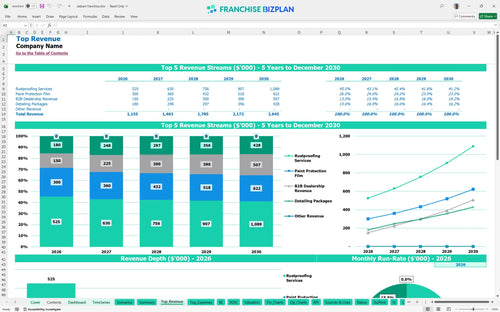
Plan for long-term growth with detailed revenue projections that scale from $1,155,000 in year one to $2,645,000 by year five. This model provides a clear view of your operating expense forecasting, including technician labor that grows from 2.0 to 4.0 full-time equivalents as your volume of paint protection and detailing jobs increases.

This franchise startup cost calculator precisely tracks your ongoing obligations, including the 8% royalty fee and 2% marketing fund contribution. By factoring these into your auto detailing franchise investment, you can see exactly how much of your $55 average ticket or high-margin rustproofing package goes toward brand support before you cover local overhead.

Use this startup budget template for vehicle protection services to estimate your total initial investment, which includes $300,000 for leasehold improvements and $180,000 for specialized spray booths and lifts. Calculating break-even point for auto protection franchise units becomes straightforward when you map these fixed costs against your projected monthly throughput.

The model incorporates industry-specific unit economics and benchmarks, such as chemical COGS starting at 12.5% and improving to 10.5% as you gain scale. This franchise ROI calculator helps you sanity-check your assumptions against typical automotive service margins to ensure your $157,000 year-one EBITDA target is realistic and achievable.


Simply purchase and download the financial model template, then access it instantly using Microsoft Excel or Google Sheets. No installation or technical expertise required-just open and start working.

Enter your business-specific numbers, including revenue projections, costs, and investment details. The pre-built formulas will automatically calculate financial insights, saving you time and effort.

Leverage the investor-ready format to confidently showcase your financial projections to banks, franchise representatives, or investors. Impress stakeholders with clear, data-driven insights and professional reports.

Leverage the investor-ready format to confidently present your projections to banks, franchise representatives, or investors.