
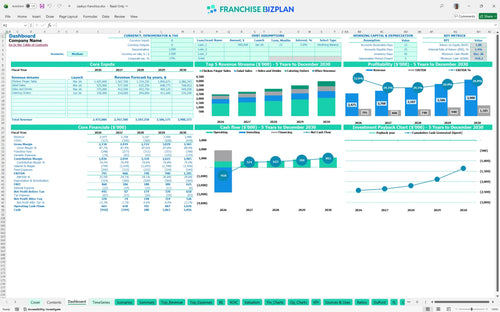
All-in-one Dashboard
Core inputs and core outputs


This Excel template for restaurant franchise financial forecasting is one of the best financial tools for multi-unit restaurant operators looking to scale efficiently.
Core inputs and core outputs
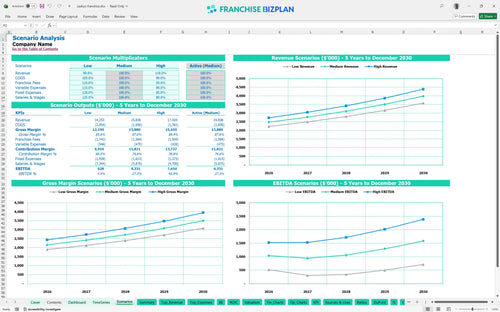
Three scenario analysis
Presentation ready
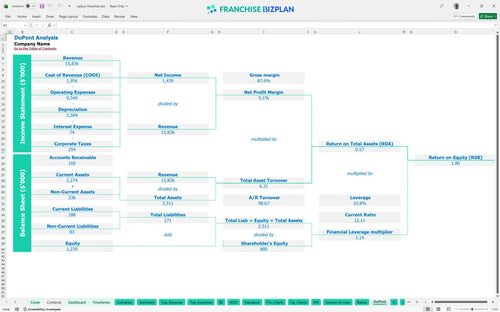
DuPont analysis
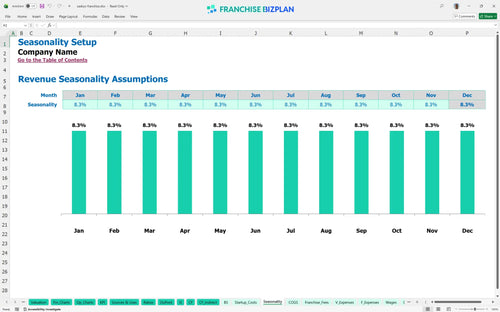
Researched revenue assumptions
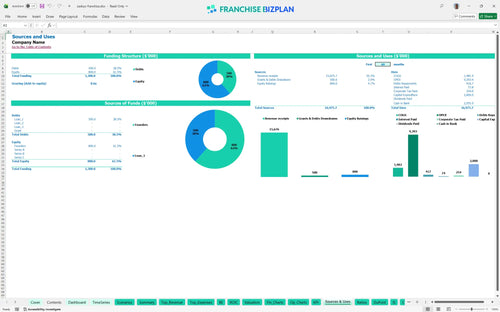
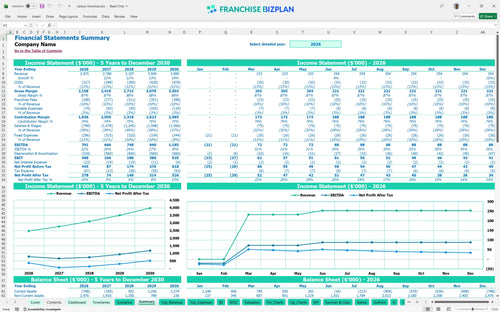
Lender-friendly financial outputs
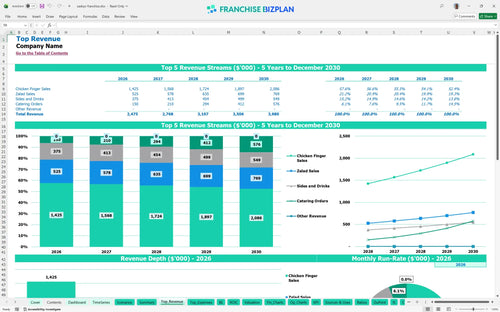
Revenue stream detailed view
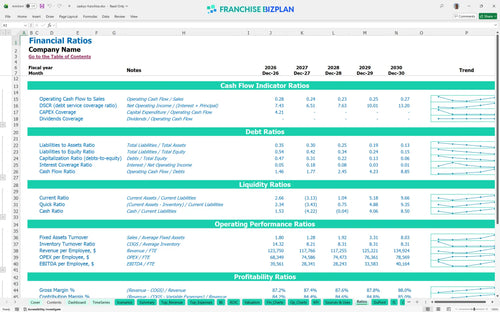
Performance metrics benchmark
We built this franchise unit financial model using our own research into the fast-casual chicken segment. Key assumptions like the $2.47M Year 1 revenue and $18,000 monthly rent are pre-populated with researched data and are fully editable to match your specific site. This model provides a pragmatic look at the unit economics, including the $791,000 Year 1 EBITDA and the path to a $3.98M Year 5 top line.
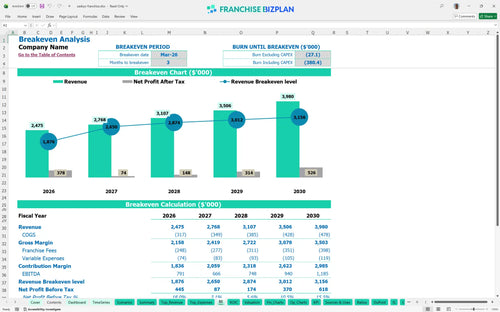
The model indicates this unit hits its stride early, reaching break-even by March 2026, just three months after the launch. While Year 1 EBITDA is strong at $791,000, the long-term play shows Year 5 revenue climbing to $3.98M as catering and app orders mature. We estimate profitability by calculating net profit after accounting for the 6% royalty, 4% marketing fees, and essential restaurant operating expenses.
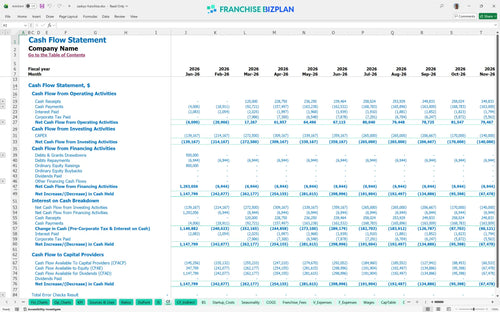
You need a total initial investment that covers the $35,000 franchise fee and significant build-out costs like the $1.25M for leasehold improvements. The model also accounts for $550,000 in kitchen equipment and $350,000 for drive-thru infrastructure to handle high-volume commuter traffic. This franchise business model financial projection spreadsheet ensures you have enough opening cash buffer to handle the -$918,000 minimum cash point.
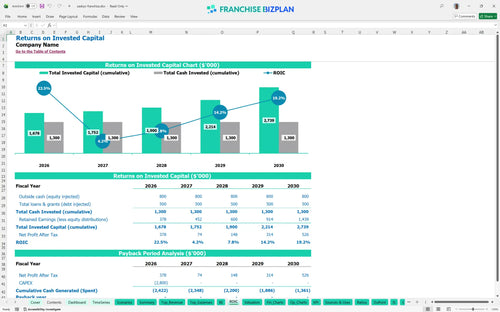
The financial feasibility study for new restaurant franchise shows an IRR of 1.36% and an ROE of 1.8 based on the current projections. While the payback period extends past the five-year mark, the steady climb in EBITDA to $1.18M by Year 5 demonstrates a sustainable long-term margin profile. This franchise ROI calculation helps you understand the balance between high upfront CAPEX and consistent annual cash flow.
The monthly break-even analysis for franchises suggests you hit the mark in March 2026, assuming you hit your Year 1 revenue target of $2.47M. The biggest driver for this is throughput in the dual-lane drive-thru, which must stay efficient to cover the $18,000 monthly rent and high labor costs. Analyzing profit margins for drive-thru restaurant locations is the key to reaching this point faster.
Your lowest cash point is -$918,000 in December 2026, which means you need a solid financing plan to bridge the gap during the initial ramp-up. This runway is critical as you wait for the high-margin catering orders and app-based loyalty sales to stabilize your cash flow. To be fair, managing your opening inventory and staffing levels during the first 90 days will be vital for protecting your liquidity.
A High scenario, driven by strong local marketing and student engagement, can pull forward profitability and boost Year 1 margins significantly. Conversely, a Low scenario with higher labor costs could defintely deepen the peak cash need and delay the payback period further. This fast casual restaurant business plan allows you to toggle these variables to see how they impact your peak cash requirement.
This franchise financial model template is built in Excel with open formulas, so you can tweak every assumption to fit your specific territory. Whether you are adjusting for local labor rates or specific site build-out costs, the editable inputs ensure your projections reflect reality rather than just a generic estimate. It is a flexible tool designed to handle the nuances of unit economics across different US markets.

Creating a budget for a fast-food franchise location requires a long-term view of how margins evolve as the unit matures. This model provides a detailed 5-year outlook on revenue and cash flow, helping you see the impact of annual growth and escalating costs over a full franchise term. It simplifies complex capital expenditure planning so you can focus on long-term profitability analysis.

The restaurant franchise revenue and expense forecasting guide helps you track the heavy hitters like the 6% royalty and 4% marketing fund contributions that eat into your top line. By automating these calculations, you can see exactly how much cash stays in the unit after the franchisor takes their cut each month. This ensures your franchise unit profit and loss template stays accurate as sales volume fluctuates.

Our restaurant startup cost calculator helps you determine how to calculate startup costs for a fast-casual franchise, from the $35,000 initial fee to the $1.25M in leasehold improvements. Knowing your break-even analysis for franchises is vital, as it tells you the exact sales volume needed to stop burning cash and start building equity. It maps out your total initial investment and monthly cost structure clearly.

Estimating labor and food costs for new franchise units is easier with built-in benchmarks for key operating and financial metrics. This model incorporates industry-standard gross margin ranges and occupancy cost benchmarks to help you sanity-check your assumptions. It is a vital part of any franchise investment analysis excel, allowing you to compare expected performance against typical fast-casual ranges.


Simply purchase and download the financial model template, then access it instantly using Microsoft Excel or Google Sheets. No installation or technical expertise required-just open and start working.

Enter your business-specific numbers, including revenue projections, costs, and investment details. The pre-built formulas will automatically calculate financial insights, saving you time and effort.

Leverage the investor-ready format to confidently showcase your financial projections to banks, franchise representatives, or investors. Impress stakeholders with clear, data-driven insights and professional reports.

Leverage the investor-ready format to confidently present your projections to banks, franchise representatives, or investors.