
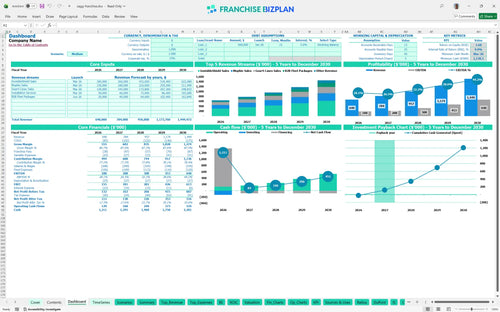
All-in-one Dashboard
Core inputs and core outputs


This financial projection spreadsheet for franchises provides a detailed roadmap for managing a technology retail unit from day-one setup through five years of operations.
Core inputs and core outputs
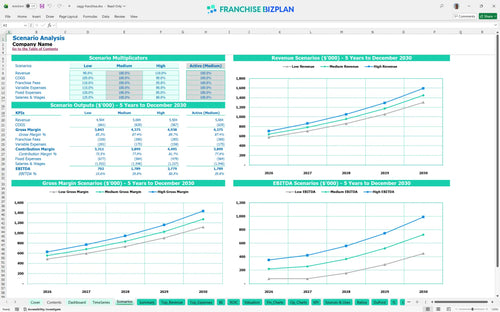
Three scenario analysis
Presentation ready
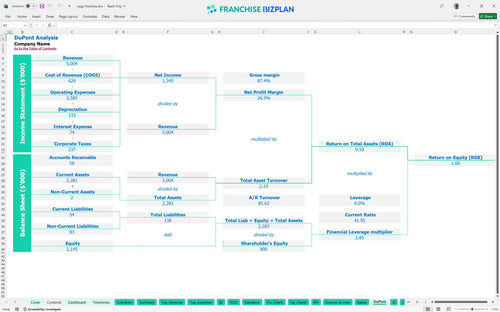
DuPont analysis
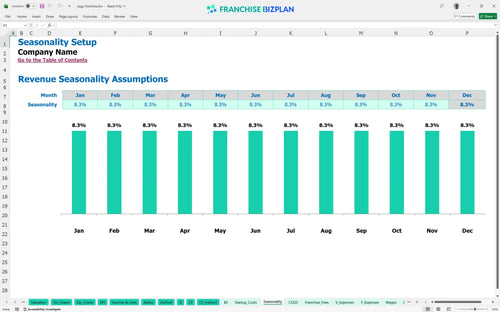
Researched revenue assumptions
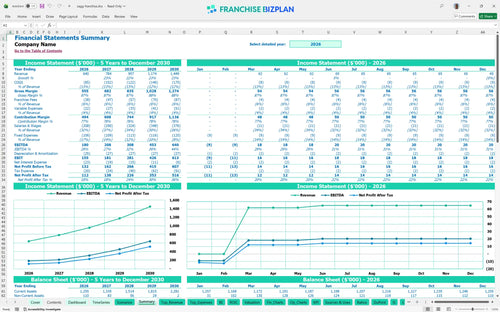
Lender-friendly financial outputs
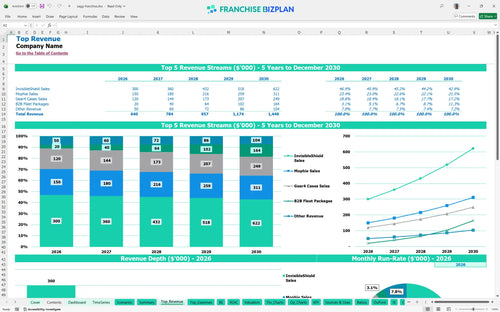
Revenue stream detailed view
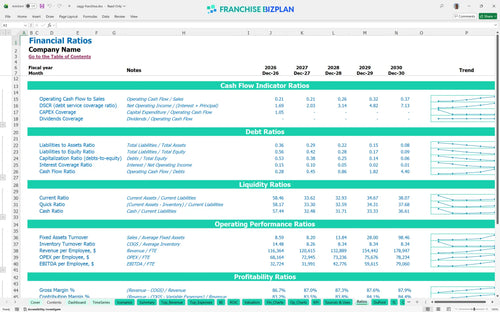
Performance metrics benchmark
We built this franchise unit financial model using our own research into the technology retail space. Key assumptions like revenue streams from screen protection and power solutions, operating expenses, and the 5% royalty fee structure are pre-populated and fully editable. At $640,000 in first-year sales, the model shows how you can hit a 28% EBITDA margin while managing your operational cost breakdown.
You can expect this unit to reach profitability quickly, with a break-even date set for April 2026. Based on the 5-year forecast, EBITDA grows from $180,000 in the first year to $640,000 by year five as you scale. Speed to profit is the only metric that matters in year one.
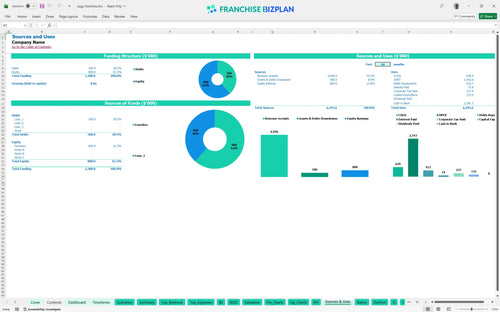
Launching this unit requires a total initial investment of approximately $135,000 in hard costs, including a $15,000 franchise fee and $40,000 for leasehold improvements. The model shows a minimum cash requirement of $1,130,000 to handle the ramp-up through the lowest cash point in March 2026. Know where every cent goes before the first contractor shows up.
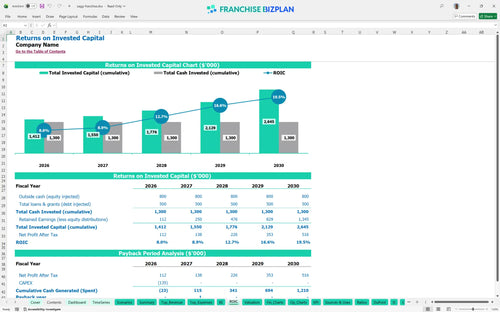
The financial model projects an Internal Rate of Return (IRR) of 9.91% and a Return on Equity (ROE) of 1.68. With a payback period of just 2 years, you recover your initial capital relatively fast for a retail concept. A 2-year payback is a strong signal for multi-unit growth.
You hit the break-even point in month 4 of operations, specifically April 2026. To cover your $6,500 monthly rent and $14,000 in monthly base wages, you need to maintain steady foot traffic and high-ticket service sales. Break-even is a milestone, not a destination.
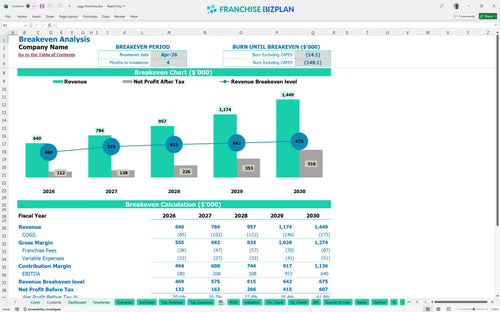
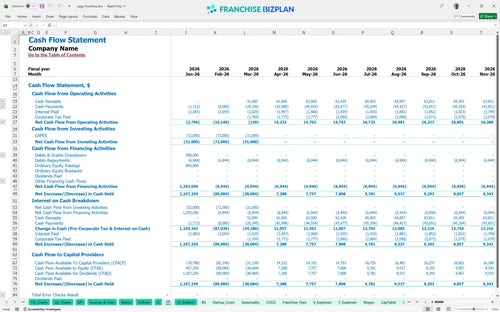
Your lowest cash point occurs in March 2026, hitting $1,130,000. While the unit breaks even quickly, you need enough liquidity to cover the pre-opening phase and the first few months of payroll. We defintely recommend keeping a 3-month operating reserve to handle any delays in B2B contract payments. Cash is oxygen; don't hold your breath too long.
The difference between scenarios comes down to B2B execution and average ticket size. In a high-growth scenario, hitting $1.4M in year 5 revenue significantly boosts your ROI and shortens the payback. Hope is not a strategy, but scenario planning is.
This franchise financial model template is built in Excel to give you total control over your unit projections. You can adjust every variable from local rent to specific technician wages, ensuring the math reflects your specific market instead of a generic estimate. It's your roadmap, not a static document.

Planning for the long haul requires more than a one-year guess. This model provides a full 5-year outlook, showing how revenue scales from $640,000 in year one to over $1.4 million by year five. Five years is the difference between a job and an asset.

Royalties and marketing fees are the franchise tax that can eat your margin if you aren't careful. This model tracks the 5% royalty and 1% brand fund contribution automatically against your revenue forecasting model. Royalties are the price of admission; track them closely.

Your initial investment goes beyond just the $15,000 franchise fee; you need to account for leasehold improvements, inventory, and equipment. This tool provides a detailed break-even point calculation, showing you need to hit specific sales targets to cover your $6,500 monthly rent. Every dollar spent pre-opening is a dollar you have to earn back twice.

Don't guess if your labor or rent costs are out of line. The model includes built-in benchmarks to help you evaluate your retail franchise startup costs against industry standards. Benchmarks keep your ego in check.


Simply purchase and download the financial model template, then access it instantly using Microsoft Excel or Google Sheets. No installation or technical expertise required-just open and start working.

Enter your business-specific numbers, including revenue projections, costs, and investment details. The pre-built formulas will automatically calculate financial insights, saving you time and effort.

Leverage the investor-ready format to confidently showcase your financial projections to banks, franchise representatives, or investors. Impress stakeholders with clear, data-driven insights and professional reports.

Leverage the investor-ready format to confidently present your projections to banks, franchise representatives, or investors.