
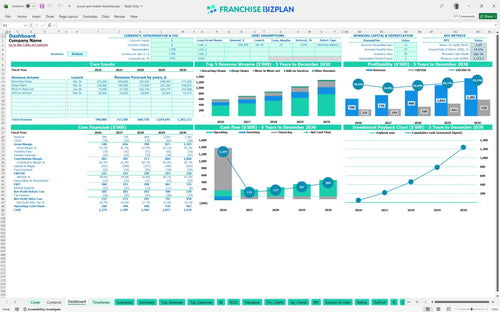
All-in-one Dashboard
Core inputs and core outputs


This template provides a professional-grade Excel framework for forecasting revenue, expenses, and investment returns for a residential cleaning franchise unit.
Core inputs and core outputs
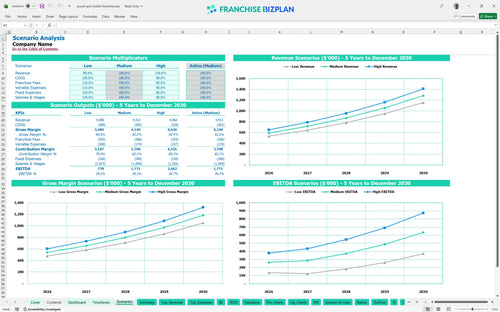
Three scenario analysis
Presentation ready
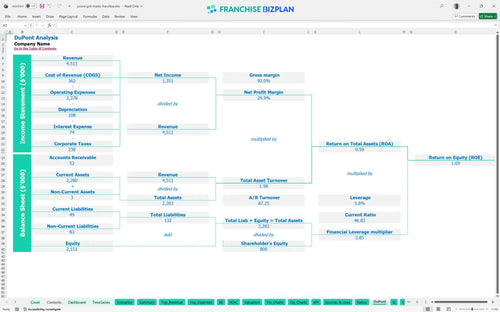
DuPont analysis
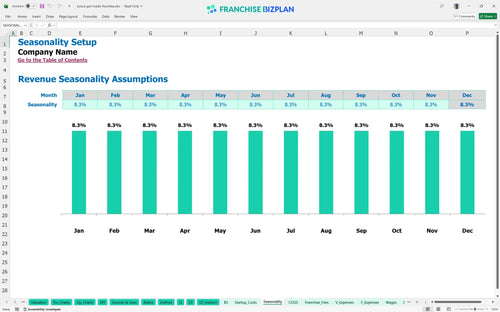
Researched revenue assumptions
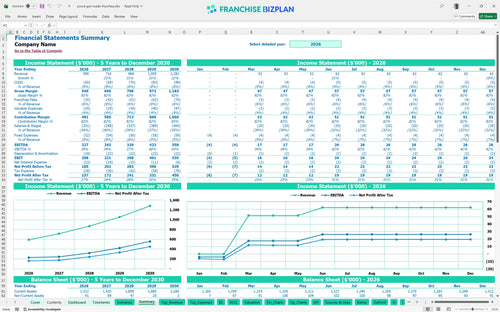
Lender-friendly financial outputs
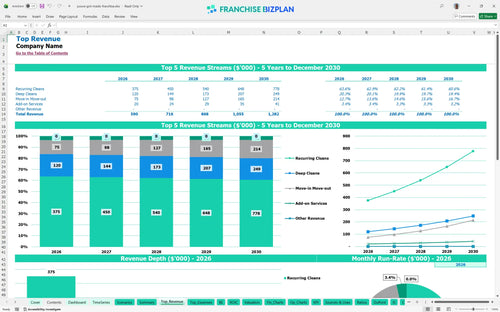
Revenue stream detailed view
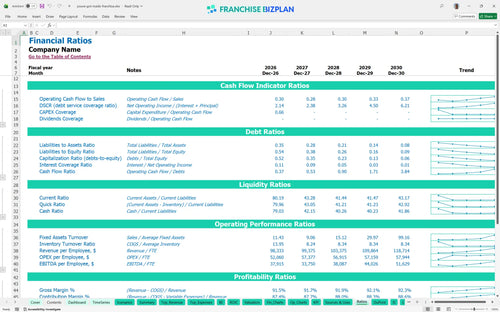
Performance metrics benchmark
We developed this financial model through deep research into the unit economics of a professional maid service. The pre-populated data reflects a year-one revenue target of $590,000 and a rapid 3-month break-even timeline, but you can fully edit the staffing, fleet, and marketing inputs to match your specific US territory.
The unit reaches proffitability in month 3, with EBITDA growing from $227,000 in year one to $558,000 by year five. This assumes you scale from 3 to 7 cleaning technicians while maintaining a steady 5.9% royalty burden and managing cleaning chemical costs effectively.
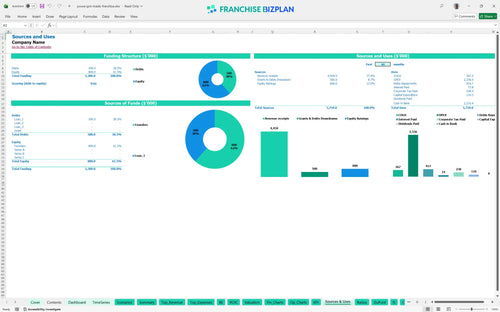
You need approximately $110,499 in startup capital requirements to launch this unit. This covers the initial franchise fee, a fleet of branded vehicles, specialized cleaning equipment, and the first month of supplies and uniforms needed to meet brand standards.
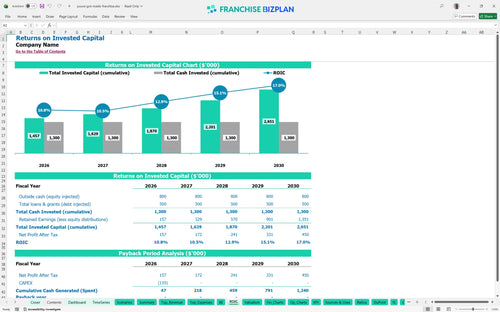
The ROI analysis for home cleaning franchise units shows an Internal Rate of Return (IRR) of 14.5% and a Return on Equity (ROE) of 1.69. While the unit generates strong annual EBITDA, the total payback period extends beyond year five due to the initial fleet and equipment heavy investment.
The unit hits its monthly break-even point in March 2026, just three months after launch. This speed is driven by the cleaning business revenue stream projections for recurring cleans, which provide $250,000 in predictable year-one volume to cover the $1,800 monthly rent and staff salaries.
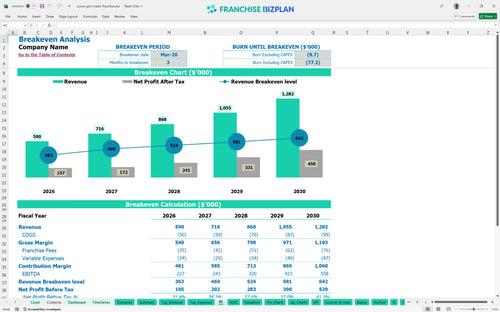
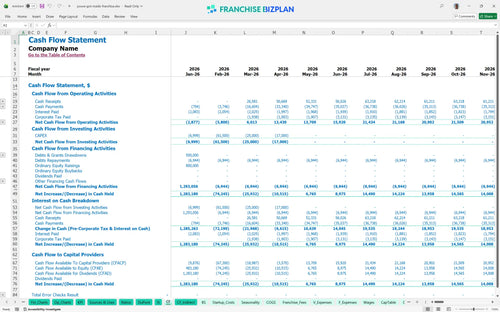
The business cash flow forecast identifies the lowest cash point in April 2026 at $1,172. This is a tight window immediately following the equipment and supply purchases, suggesting you should maintain a small additional cash buffer to handle any delays in customer payments during month four.
A profit margin analysis for residential cleaning service shows that a 10% drop in revenue defintely pushes the break-even point back by several months and increases the peak cash need. Conversely, hitting the high scenario by maximizing move-in/move-out contracts can double your year-one EBITDA and accelerate the payback timeline significantly.
Finance: update unit break-even and payback model by Friday.
This franchise unit financial model is built in Excel with fully editable assumptions, allowing you to plug in your specific territory data and local market rates. All formulas are pre-filled so you can adjust pricing, staffing levels, or rent costs to see the immediate impact on your bottom line without building a spreadsheet from scratch.

Plan for long-term growth with a detailed 5-year outlook that maps your path from a single territory to a mature operation. The model tracks revenue scaling from $590,000 in year one to over $1.28 million by year five, providing a clear roadmap for cash flow management and multi-unit expansion planning.

Operating a franchise means managing specific financial obligations like the 5.9% royalty fee and initial brand investments. This model captures these recurring costs automatically against your gross sales, ensuring you understand exactly how much cash stays in the business after meeting your contractual brand requirements.

Estimating your total initial investment is critical to avoid mid-launch cash crunches. This tool breaks down everything from the $6,999 franchise fee to the $54,000 fleet acquisition, helping you calculate the exact sales volume needed to cover your fixed monthly overhead and reach your break-even point.

Use built-in industry benchmarks to sanity-check your operating assumptions against typical performance in the home services sector. By comparing your projected labor costs and gross margins to standard ranges, you can identify potential margin leaks in your service delivery before they impact your actual bank balance.


Simply purchase and download the financial model template, then access it instantly using Microsoft Excel or Google Sheets. No installation or technical expertise required-just open and start working.

Enter your business-specific numbers, including revenue projections, costs, and investment details. The pre-built formulas will automatically calculate financial insights, saving you time and effort.

Leverage the investor-ready format to confidently showcase your financial projections to banks, franchise representatives, or investors. Impress stakeholders with clear, data-driven insights and professional reports.

Leverage the investor-ready format to confidently present your projections to banks, franchise representatives, or investors.