
All-in-one Dashboard
Core inputs and core outputs


This comprehensive Excel template for pizza restaurant startup costs includes dynamic calculators for revenue, labor, CAPEX, and 5-year P&L statements tailored for franchise operations.
Core inputs and core outputs
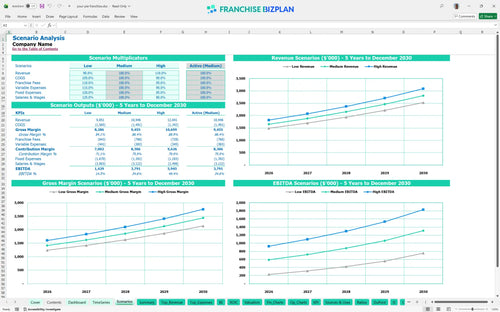
Three scenario analysis
Presentation ready
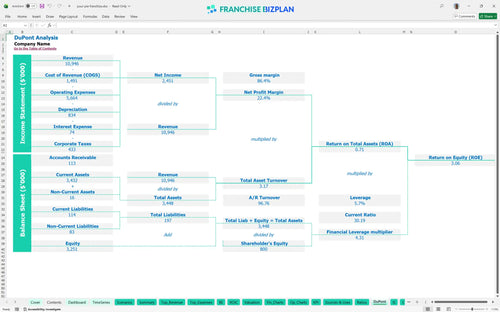
DuPont analysis
Researched revenue assumptions
Lender-friendly financial outputs
Revenue stream detailed view
Performance metrics benchmark
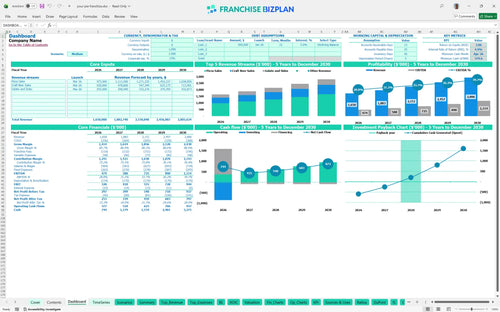
We built this franchise unit financial model using our own deep-dive research into the fast-casual pizza sector. Key assumptions, including the $1.65M year-one revenue target and the $16,500 prime location rent, are pre-populated and fully editable to match your specific territory. This tool is designed to move you from guessing to knowing by mapping out the actual cash requirements for a high-volume artisan pizza unit.
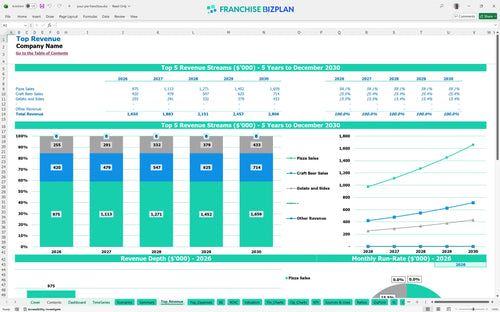
The unit reaches profitability quickly, showing a positive EBITDA of $474,000 in the first year after accounting for 11.5% food costs and 7% total franchise fees. By year five, scaling revenue to $2.8M allows EBITDA to climb to $1.114M as fixed costs like rent are leveraged. Here is the quick math: margin expansion depends on keeping food waste low and maximizing the $475k craft beer revenue stream.
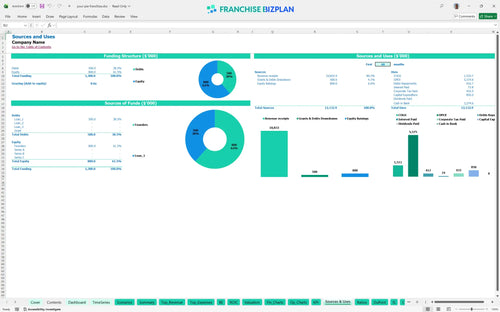
You will need approximately $850,000 to get this unit off the ground, covering everything from the $380,000 leasehold improvements to the specialized brick oven. This capital expenditure planning includes a $380,000 minimum cash requirement to handle the ramp-up phase through the first few months. Plus, you need to account for the $75,000 bar system to capture those essential beverage sales.
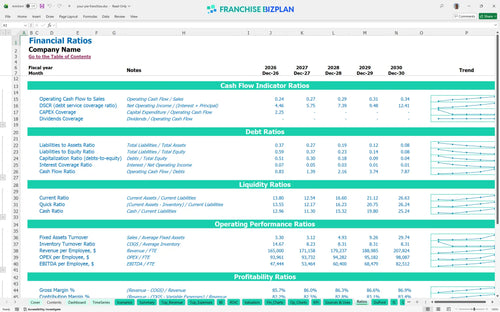
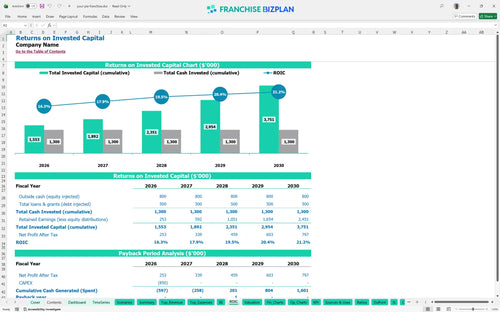
Investors can expect a 3-year payback period on the initial capital outlay, which is solid for the fast-casual pizza space. The model shows an Internal Rate of Return (IRR) of 4.92% and a Return on Equity (ROE) of 3.06% based on the five-year cash flow projections. Calculating return on investment for restaurant franchises is tricky, but the steady climb in net margin makes this a stable long-term play.
The unit is projected to hit its monthly break-even point in April 2026, just four months after the March launch. This quick turn depends heavily on hitting the $650,000 annualized pizza sales target while managing the $16,500 monthly rent. If throughput slows down or the $55,000 furniture and seating plan doesn't support enough turns, that break-even date will defintely slide.
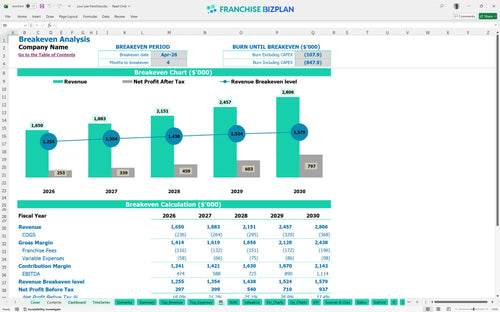
The lowest cash point occurs in April 2026, with a minimum cash balance of $380,000 required to bridge the gap between build-out and operational stability. You need to maintain a tight grip on the $850,000 startup budget to ensure you don't run dry before the revenue from the $280,000 beer program kicks in. Still, the model suggests that once you clear month four, the cash flow becomes self-sustaining.
In a high-growth scenario, hitting $2.8M in revenue by year five dramatically improves your ROI and shortens the payback period. Conversely, a low-revenue scenario where pizza sales lag below the $650,000 year-one mark would require a larger cash buffer to cover the fixed $16,500 rent. Evaluating franchise investment opportunities means looking at these spreads to see if the $474k year-one EBITDA has enough cushion for a slow start.
This franchise financial model template provides a flexible Excel environment where every assumption is live and ready for your specific market data. You can adjust pre-filled formulas for local labor rates or specific site build-outs, making it easy to see how different operating scenarios impact your bottom line. Honestly, having a tool that lets you toggle revenue drivers without breaking the math is the only way to defintely stress-test a deal before signing the lease.

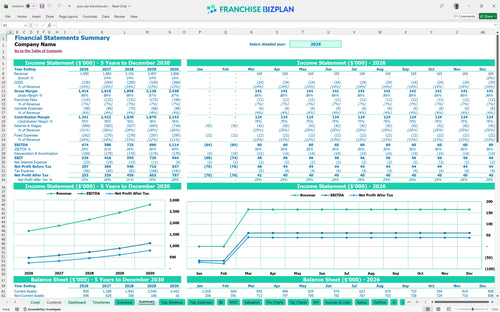
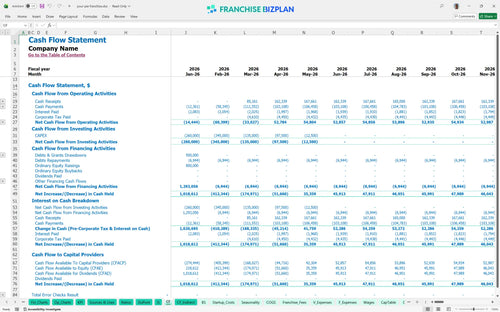
Mapping out a pizza franchise business plan requires looking past the grand opening to see how the unit matures over half a decade. This model tracks a growth trajectory from $1.65M in year one revenue up to $2.8M by year five, providing a detailed view of cash flow and long-term profitability analysis. It gives you the visibility needed to plan for equipment refreshes or multi-unit expansion while keeping a close eye on the balance sheet.

Operating within a system means accounting for franchise royalty fees and brand fund contributions that come right off the top. This model calculates the 5% royalty and 2% marketing fee against your projected sales, so you see the exact dollar amount leaving the store every month. It's a reality check on your store-level margin, ensuring you understand the true cost of brand support and national marketing before you commit.

Getting the doors open requires a clear restaurant startup cost spreadsheet that covers everything from the brick oven to the patio furniture. This tool helps you perform a break-even analysis by comparing your $16,500 monthly rent and fixed overhead against your contribution margin per ticket. You will know exactly what daily sales volume is required to stop the bleeding and start generating a return on your initial investment.

We have integrated operational cost management benchmarks to help you sanity-check your food and labor projections against industry standards. If your food ingredients are hitting 11.5% but your labor is creeping too high, the model flags the variance so you can adjust your staffing levels. It is a data-driven way to ensure your franchise unit financial projections stay grounded in the reality of fast-casual restaurant economics.


Simply purchase and download the financial model template, then access it instantly using Microsoft Excel or Google Sheets. No installation or technical expertise required-just open and start working.

Enter your business-specific numbers, including revenue projections, costs, and investment details. The pre-built formulas will automatically calculate financial insights, saving you time and effort.

Leverage the investor-ready format to confidently showcase your financial projections to banks, franchise representatives, or investors. Impress stakeholders with clear, data-driven insights and professional reports.

Leverage the investor-ready format to confidently present your projections to banks, franchise representatives, or investors.