
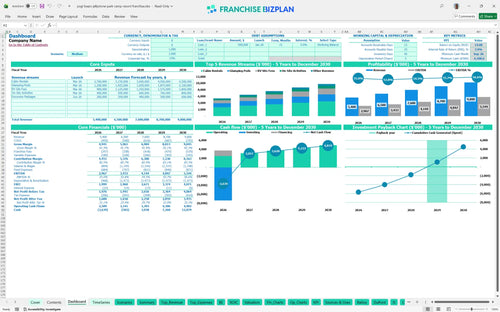
All-in-one Dashboard
Core inputs and core outputs


This comprehensive Excel template for campground franchise financial projections includes detailed tabs for revenue modeling, payroll, CAPEX, and integrated financial statements.
Core inputs and core outputs
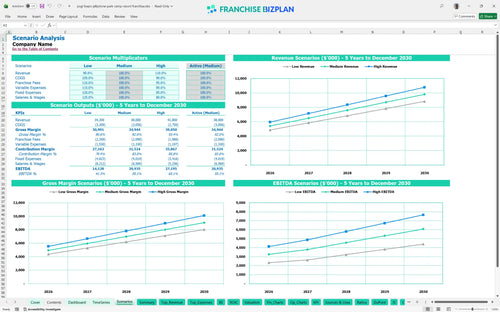
Three scenario analysis
Presentation ready
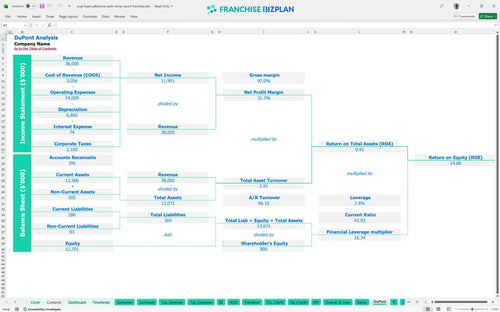
DuPont analysis
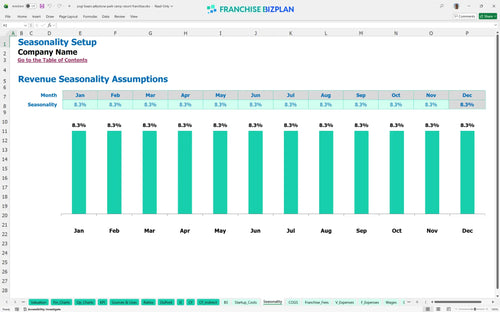
Researched revenue assumptions
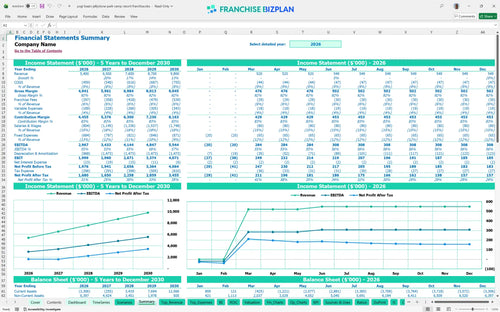
Lender-friendly financial outputs
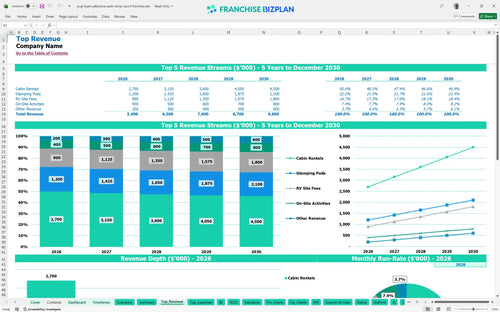
Revenue stream detailed view
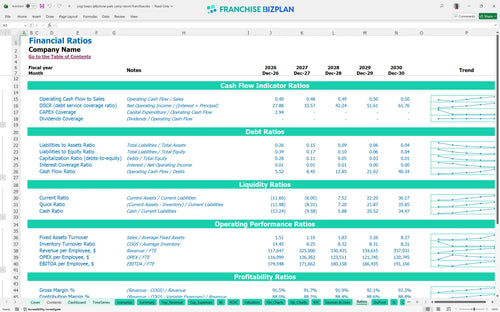
Performance metrics benchmark
We built this franchise unit financial model using detailed research into the outdoor hospitality sector. Key assumptions for revenue streams like cabin rentals and RV fees, plus operating expenses and a $15,000 franchise fee, are pre-populated and fully editable to reflect your specific territory. The model shows a year-one revenue target of $5,400,000 with a strong EBITDA of $2,967,000.
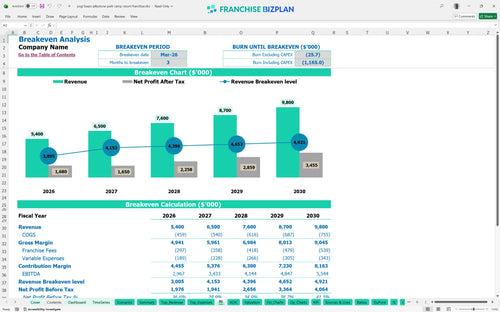
Based on the researched data, this resort franchise reaches its break-even point in March 2026, just three months after the initial launch phase. Calculating profitability for family-oriented camping resorts shows that net profit grows steadily as revenue climbs from $5.4M in year one to $9.8M by year five.
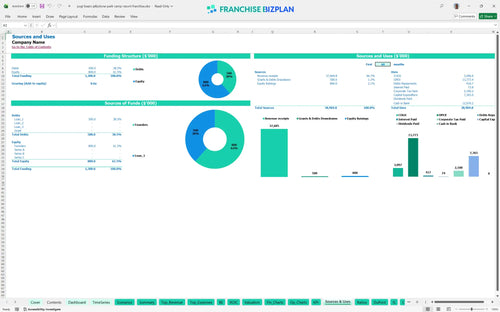
Launching this outdoor hospitality project requires significant capital, with site development and cabin construction being the largest drivers. The total initial investment covers the $15,000 franchise fee plus over $6.5 million in physical infrastructure, including a $1.2M water zone facility and $800,000 for glamping pods.
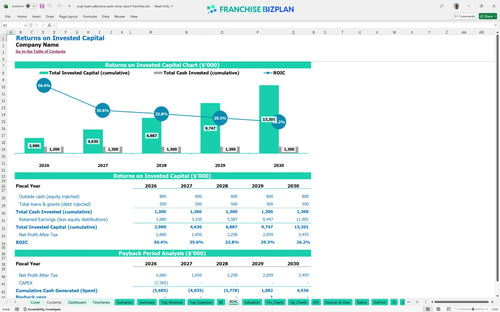
The hospitality business ROI for this model shows an Internal Rate of Return (IRR) of 3.87% and a Return on Equity (ROE) of 14.88%. While the upfront costs are high, the multi-revenue stream modeling leads to a full payback within 4 years of operation as the unit matures.
You reach monthly break-even by March 2026, assuming you hit the $5.4M annual revenue target in year one. The biggest pressure on this point is the $25,000 monthly utility bill and the $64,500 total fixed monthly overhead required to maintain the property and character-driven programming.
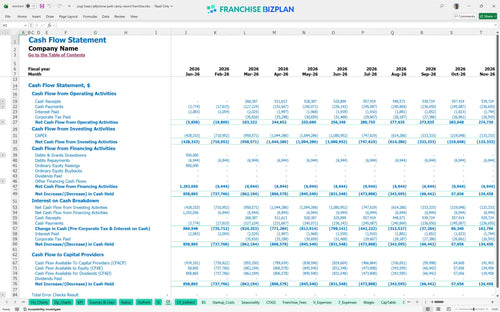
The lowest cash point occurs in September 2026, showing a deficit of $4,109,000 due to the timing gap between construction spending and peak revenue. You defintely need a robust working capital reserve to bridge the gap until the resort reaches mature occupancy levels and consistent cash flow.
A financial feasibility study for luxury RV park development must account for occupancy swings. High-performing units see faster payback through better throughput at the water zone, while low scenarios may delay profitability by 12+ months if labor and marketing costs aren't adjusted quickly to match demand.
This campground franchise financial model is built in Excel, allowing you to tweak every variable from site count to seasonal pricing. Pre-filled formulas handle the heavy lifting, so you can focus on testing different occupancy levels or labor structures for your specific location.

Planning an outdoor hospitality investment analysis requires a long-range view of how cabin rentals and RV fees scale over time. This model provides a full 5-year outlook on revenue, cash flow, and net profit to help you see the path from land development to a mature resort operation.

Managing a franchise royalty fee calculation is vital for protecting your store-level margin. The model automatically applies the 3.5% royalty and 2% marketing fund contributions against your projected sales, ensuring you see the true net cash available after all brand-related financial obligations.

How to estimate startup costs for an outdoor resort franchise involves heavy upfront capital for site development and infrastructure. This tool calculates your total initial investment and identifies the exact revenue volume needed to cover your monthly fixed costs, which total approximately $64,500 in this model.

Use this franchise unit financial projection to compare your numbers against hospitality standards. We include built-in benchmarks for labor and occupancy to ensure your operating expense budget stays realistic while you scale your character-driven programming and water zone amenities.


Simply purchase and download the financial model template, then access it instantly using Microsoft Excel or Google Sheets. No installation or technical expertise required-just open and start working.

Enter your business-specific numbers, including revenue projections, costs, and investment details. The pre-built formulas will automatically calculate financial insights, saving you time and effort.

Leverage the investor-ready format to confidently showcase your financial projections to banks, franchise representatives, or investors. Impress stakeholders with clear, data-driven insights and professional reports.

Leverage the investor-ready format to confidently present your projections to banks, franchise representatives, or investors.