
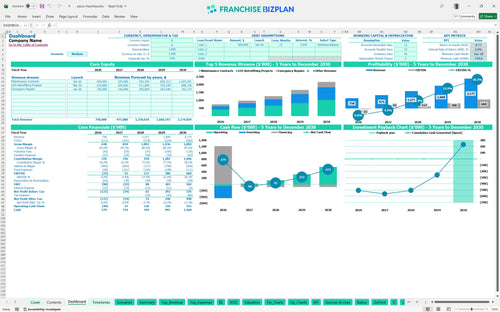
All-in-one Dashboard
Core inputs and core outputs


This Excel template for franchise unit financial planning includes detailed revenue drivers, a full staffing plan, CAPEX schedules, and 5-year pro forma statements.
Core inputs and core outputs
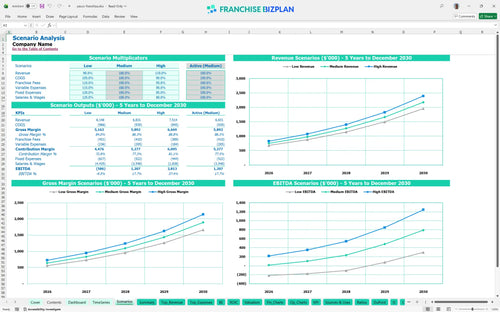
Three scenario analysis
Presentation ready
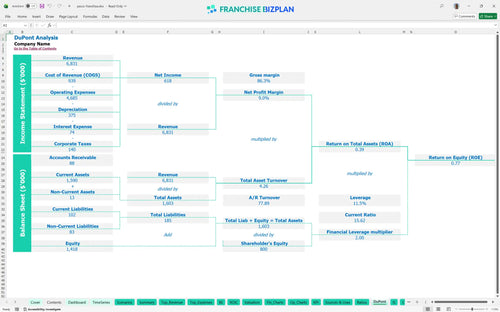
DuPont analysis
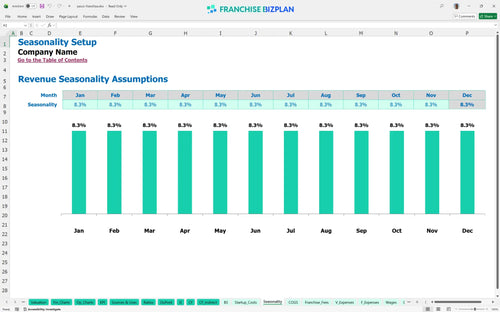
Researched revenue assumptions
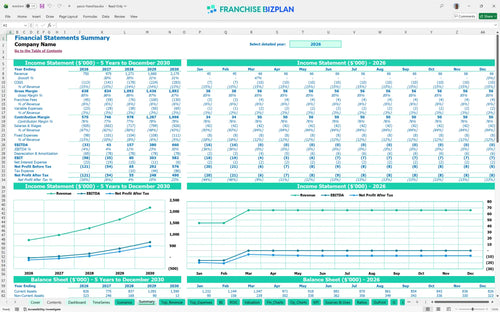
Lender-friendly financial outputs
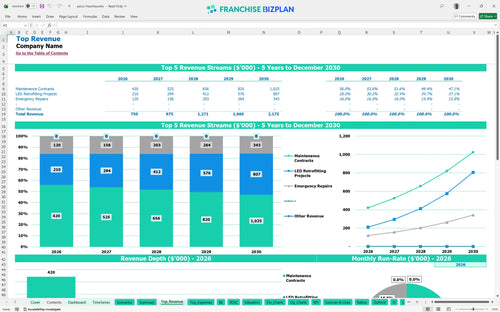
Revenue stream detailed view
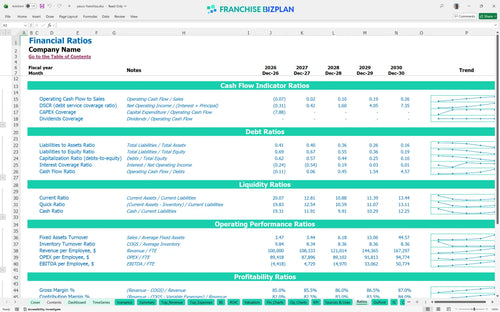
Performance metrics benchmark
We built this franchise unit financial model using detailed research on the commercial maintenance sector. Key assumptions, including $750,000 in year-one revenue and $388,000 in initial capital expenditures, are pre-populated and fully editable to reflect your specific market. This model provides a realistic look at how maintenance contracts and LED retrofitting projects drive the bottom line for a new operator.
The unit is projected to reach positive EBITDA in Year 2, generating approximately $43,000 after covering all operating costs and royalties. While Year 1 shows a small $33,000 loss during ramp-up, the scaling of maintenance contracts leads to a significant jump to $157,000 in EBITDA by Year 3. This proftability trajectory depends heavily on managing the 11.5% parts cost and technician productivity.
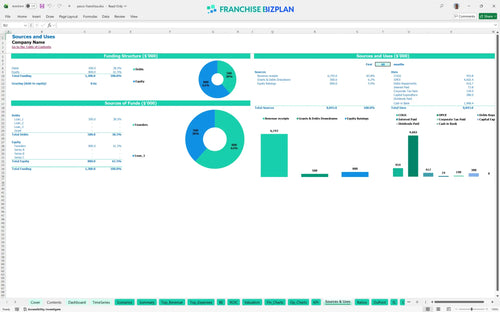
You will need approximately $388,000 in initial capital to cover the core startup costs for this franchise unit. This includes the $50,000 franchise fee and $180,000 for the essential aerial lift trucks required for service. The model also accounts for $60,000 in facility buildout and $35,000 for specialized diagnostic tools to ensure you are fully equipped on day one.
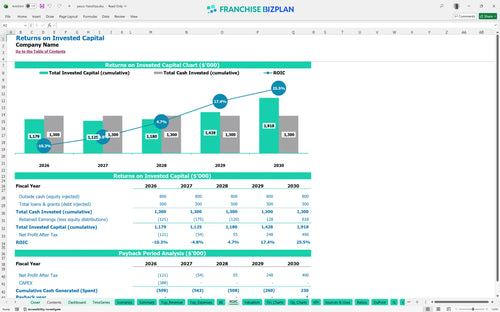
Based on the 5-year forecast, the model estimates an Internal Rate of Return (IRR) of 2% with a full payback of the initial investment by the end of year five. The Return on Equity (ROE) stands at 0.77, reflecting the capital-intensive nature of the equipment fleet. While the initial years focus on debt service and recovery, Year 5 shows a robust net margin as revenue hits $2.17 million.
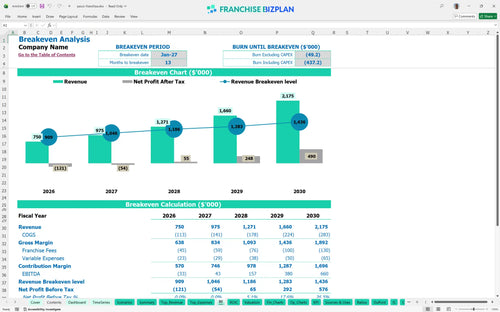
The franchise unit hits its monthly break-even point in January 2027, roughly 13 months after launching operations. The primary driver for reaching this milestone is the volume of recurring maintenance contracts, which provide the steady cash flow needed to cover $4,000 in monthly rent and $8,600 in monthly insurance and utilities. High fixed labor costs for skilled technicians mean you need consistent job volume to stay in the black.
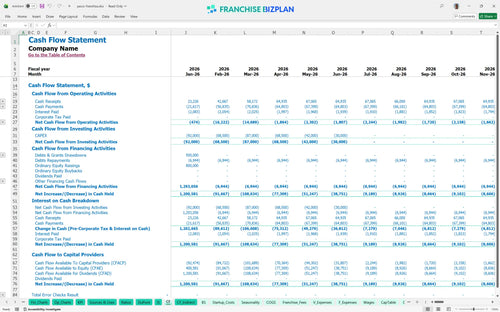
The lowest cash point occurs in January 2028, with a minimum cash requirement of $719,000 to navigate the ramp-up and equipment financing. You should defintely maintain a healthy buffer because the gap between paying for parts and receiving project payments can strain working capital. Forecasting recurring revenue for facility service franchises helps you anticipate these dips before they become crises.
A 10% drop in revenue in a 'Low' scenario can push the break-even date back by six months and significantly increase the peak cash need. Conversely, the 'High' scenario-driven by aggressive LED retrofitting sales-can double the Year 3 EBITDA and shorten the payback period to under four years. The model allows you to toggle these variables to see how sensitive your ROI is to changes in labor efficiency and material costs.
Finance: update unit break-even and payback model by Friday.
This franchise financial model provides a flexible Excel environment where every assumption is editable to match your specific territory. You can adjust the pre-filled formulas for this service-based franchise business model to reflect local labor rates, rent variations, and specific equipment financing terms. It is designed to be a living document that grows from a simple franchise startup cost calculator into a full operational tool.

Planning for a single unit requires looking past the first 12 months to understand how commercial sign maintenance revenue scales over time. This model delivers 5-year projections, showing a path from $750,000 in initial annual sales to over $2.1 million by year five. It provides a clear view of long-term profitability analysis, helping you map out when to add more technicians or trucks as your recurring revenue business model matures.

The model simplifies the math behind your ongoing obligations, specifically the 6% royalty fee applied to your gross sales. By automating these calculations, you can see exactly how much cash leaves the business before you cover your local fixed costs like rent and insurance. Understanding these franchise-specific financial obligations is vital for a precise franchise ROI calculation and managing store-level margins.

Launching a maintenance business involves significant upfront capital, from the $50,000 franchise fee to $180,000 for specialized aerial lift trucks. This tool functions as a step-by-step franchise financial model guide, helping you estimate the total initial investment and the monthly sales needed to hit break-even. It ensures you don't miss hidden costs like the $25,000 initial LED parts inventory or IT setup fees.

We have integrated industry-standard benchmarks so you can sanity-check your labor costs and occupancy expenses against typical service-based franchises. If your technician payroll or vehicle fuel costs drift too far from the 3.5% benchmark, the model highlights the gap. This helps you maintain a realistic profit and loss statement for service-based franchise operations while keeping an eye on your store-level EBITDA.


Simply purchase and download the financial model template, then access it instantly using Microsoft Excel or Google Sheets. No installation or technical expertise required-just open and start working.

Enter your business-specific numbers, including revenue projections, costs, and investment details. The pre-built formulas will automatically calculate financial insights, saving you time and effort.

Leverage the investor-ready format to confidently showcase your financial projections to banks, franchise representatives, or investors. Impress stakeholders with clear, data-driven insights and professional reports.

Leverage the investor-ready format to confidently present your projections to banks, franchise representatives, or investors.