
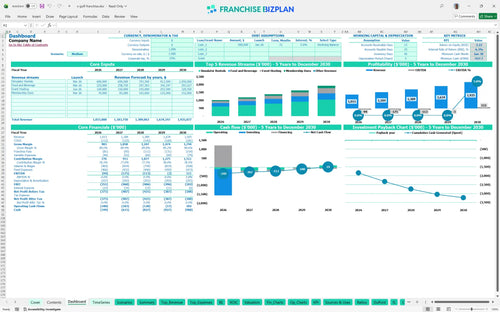
All-in-one Dashboard
Core inputs and core outputs


The franchise financial model excel spreadsheet includes dynamic calculators for revenue forecasting, staffing schedules, and a sample franchise unit P&L statement to simplify your planning process.
Core inputs and core outputs
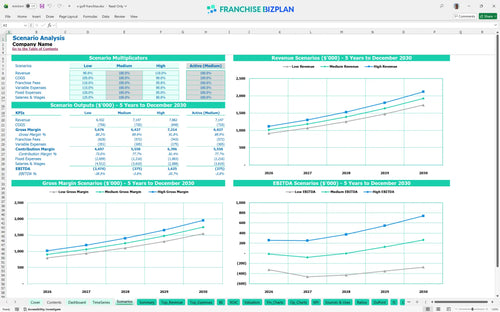
Three scenario analysis
Presentation ready
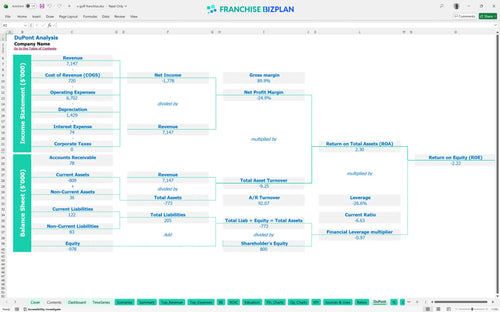
DuPont analysis
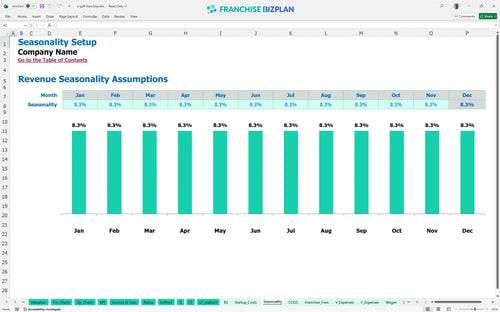
Researched revenue assumptions
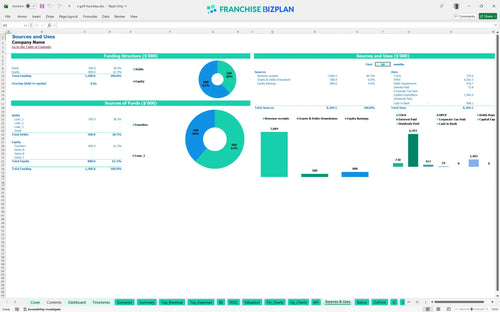
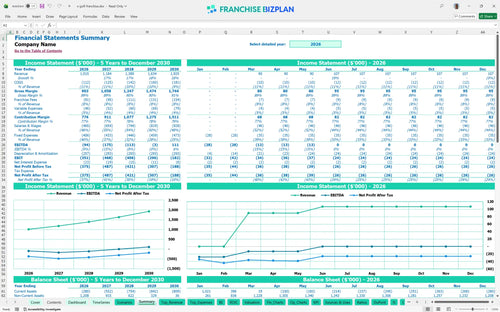
Lender-friendly financial outputs
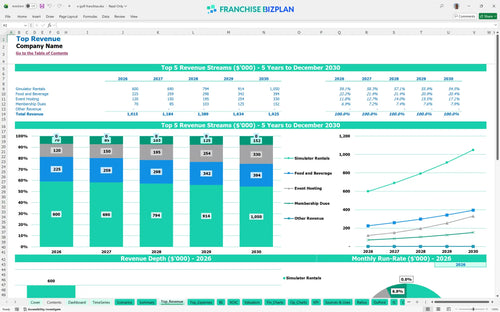
Revenue stream detailed view
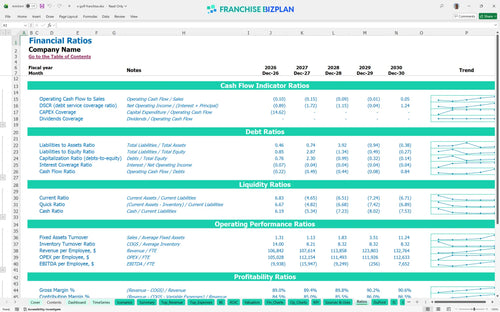
Performance metrics benchmark
We built this indoor sports facility financial projection template using deep research into the golf entertainment sector. The model comes pre-loaded with specific data points like $1.01M in year-one revenue and a 38-month window to reach break-even. You can use these figures as a baseline or edit them to reflect your specific golf entertainment franchise investment strategy.
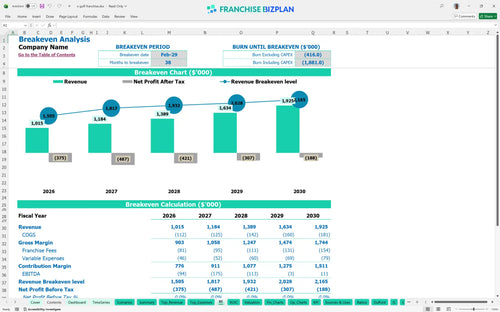
The unit reaches operational profitability in year five, generating a projected EBITDA of $111,000. While the early years face heavy depreciation and ramp-up costs, the revenue forecasting shows a steady climb from $1.01M to $1.92M as membership and event hosting mature.
You will need approximately $1.46M in startup capital to cover the initial build-out and equipment. This budget includes the $40,000 franchise fee, $650,000 for simulators, and $450,000 for leasehold improvements to create a premium lounge environment.
Based on the five-year forecast, the ROI analysis shows a payback period extending beyond the first 60 months of operation. The internal rate of return (IRR) is currently modeled at -6.34% for this specific five-year window, reflecting the high initial investment in technology and real estate.
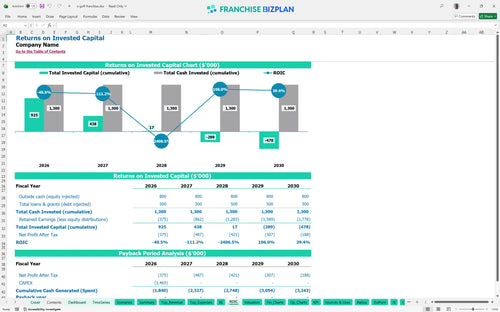
The franchise unit financial analysis guide indicates a break-even date of February 2029, or 38 months after launch. The primary driver for this timing is the $25,000 monthly rent and the 7% royalty burden, which require high throughput in simulator rentals to cover.
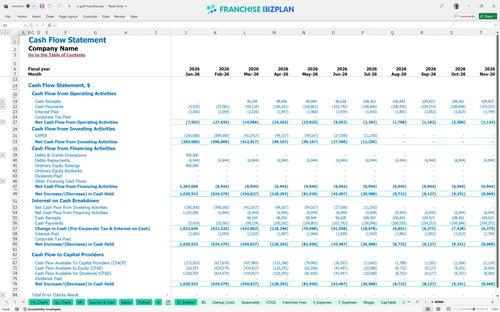
The golf bar franchise startup budget hits its lowest cash point of -$928,000 in January 2030. This suggests you need a significant working capital buffer or financing to bridge the gap between the initial $1.46M investment and the point where the unit becomes self-sustaining.
Financial forecasting for entertainment franchises shows that a 10% swing in revenue significantly alters the peak cash need. In a high-case scenario where event hosting scales faster, the year-5 EBITDA could double, whereas a low-case scenario might delay break-even by another 12 months.
This franchise financial model template provides a fully editable Excel environment where you can adjust every variable to fit your specific market. The tool includes pre-filled formulas and logic for revenue drivers and cost structures, making it simple to swap out assumptions for different territories or facility sizes. You can defintely modify the inputs to see how changing your simulator count or bar layout impacts the bottom line.

Planning for a high-end entertainment venue requires a long-term view of how traffic scales over time. This model delivers comprehensive franchise unit financial projections covering five years of revenue, expenses, and cash flow to help you visualize the ramp-up period. It tracks the transition from the initial launch phase to a mature operation with $1.92M in annual sales by year five.

The model handles the specific financial obligations of the brand, including the initial $40,000 franchise fee and ongoing 7% royalty payments. By automating these calculations based on your monthly revenue, you get a clear picture of the franchise unit economics after the franchisor takes their cut. It also accounts for the 1% marketing fund contribution to ensure your local margins are calculated accurately.

Launching an indoor sports facility requires significant upfront capital, particularly for high-tech simulator equipment and premium leasehold improvements. This tool helps you calculate startup costs for indoor golf franchise units by aggregating all CAPEX (capital expenditure) and pre-opening expenses. It maps out exactly when your monthly revenue will finally overtake your fixed and variable costs.

We integrated researched benchmarks for labor, rent, and COGS (cost of goods sold) to help you sanity-check your business plan for golf entertainment venue operations. For example, food and beverage ingredients are modeled to start at 9.5% of sales, while rent for a prime location is pegged at $25,000 monthly. These figures allow you to compare your projected profit margins for indoor golf simulator business units against typical industry standards.


Simply purchase and download the financial model template, then access it instantly using Microsoft Excel or Google Sheets. No installation or technical expertise required-just open and start working.

Enter your business-specific numbers, including revenue projections, costs, and investment details. The pre-built formulas will automatically calculate financial insights, saving you time and effort.

Leverage the investor-ready format to confidently showcase your financial projections to banks, franchise representatives, or investors. Impress stakeholders with clear, data-driven insights and professional reports.

Leverage the investor-ready format to confidently present your projections to banks, franchise representatives, or investors.