


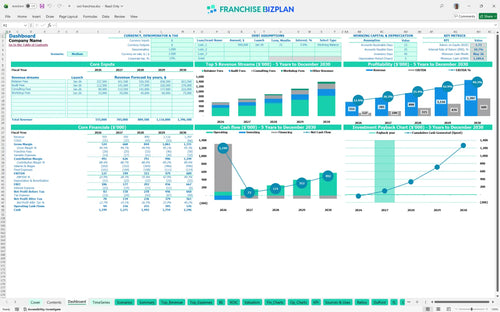
All-in-one Dashboard
Core inputs and core outputs



This Excel template for franchise financial planning includes five years of pro forma statements, a startup cost calculator, and detailed break-even analysis for a digital consulting unit.
Core inputs and core outputs
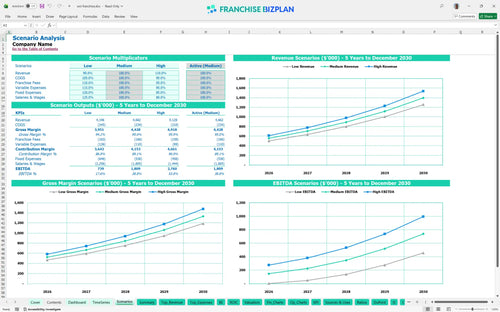
Three scenario analysis
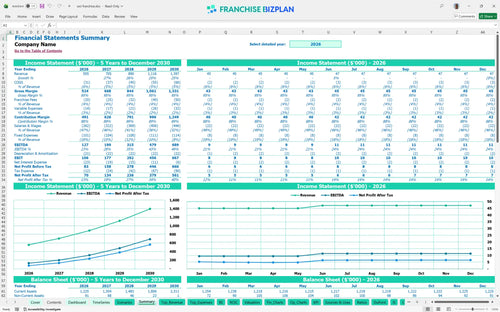
Presentation ready
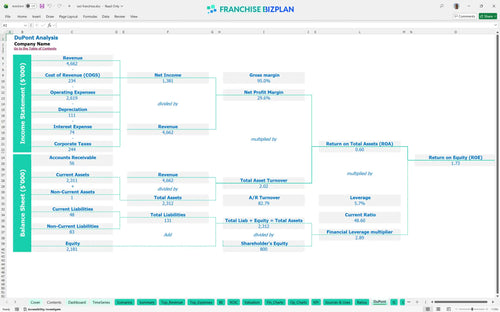
DuPont analysis
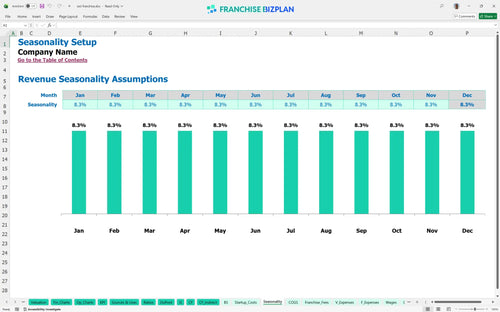
Researched revenue assumptions
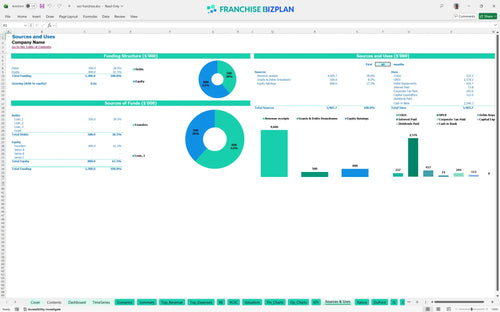
Lender-friendly financial outputs
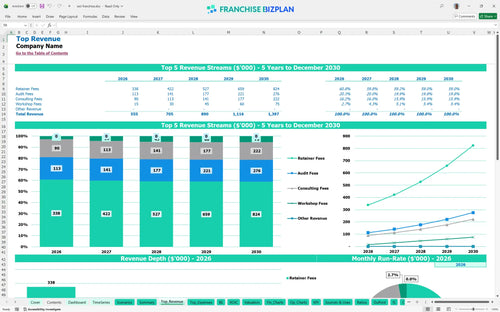
Revenue stream detailed view
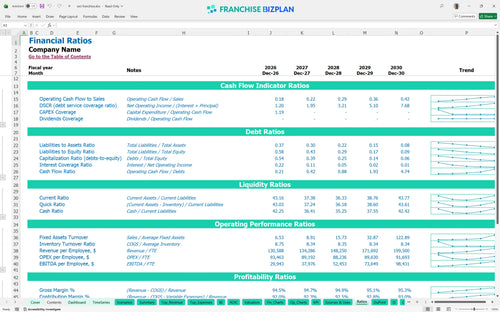
Performance metrics benchmark
We built this franchise unit financial model using our own research to help you navigate the start-up phase. Key assumptions like the $555,000 year-one revenue and the 3.56% royalty fee are pre-populated and fully editable to match your specific territory. This franchise investment analysis spreadsheet provides a realistic look at cash flow, from the initial fit-out to the $689,000 EBITDA expected by year five.
This franchise unit becomes profitable in its first year of operation, specifically by January 2026. Assessing profitability of a digital marketing franchise is straightforward here because the model shows a very fast ramp-up to a $127,000 year-one EBITDA. Profitability comes fast in this service model.
You will need roughly $112,000 to get the doors open, with the largest chunk being the $64,700 franchise fee. This financial forecasting tool for franchise owners ensures you account for the $10,000 office fit-out and $10,000 in computer equipment needed to start. Your biggest check goes to the franchise fee.
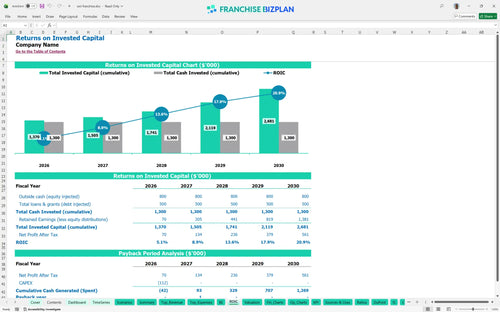
Calculating return on investment for service-based franchises shows an IRR of 10.69% and a 1.73 return on equity. The payback period is remarkably short at just 2 years, meaning you recover your initial capital quickly if you hit the $555,000 year-one revenue target. A two-year payback is a strong result.
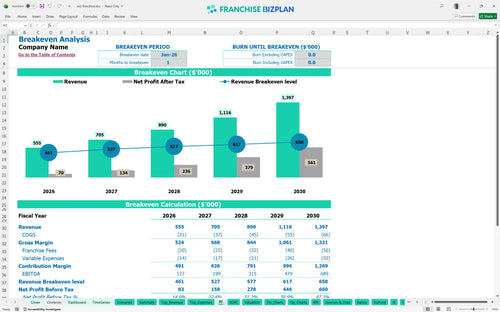
The monthly break-even happens almost immediately because the fixed costs, like the $6,000 rent and $65,000 manager salary, are offset by high-value retainer fees. Operational expense forecasting shows that you only need one month to reach the break-even date of January 2026. Low overhead is the secret to early break-even.
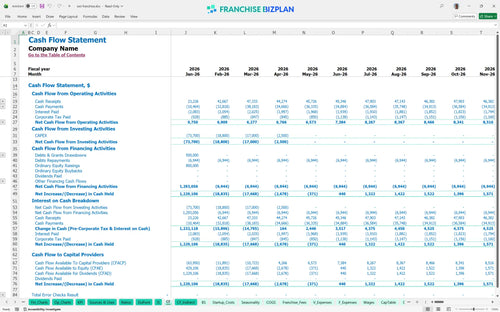
The lowest cash point is projected for May 2026 at $1,190,000, which includes your initial funding and early revenue. Best practices for franchise unit budget forecasting suggest keeping a tight grip on your cash runway during the first six months, as client payment delays could tighten things defintely. Cash is king during the ramp-up months.
How to build a 3-year financial model for a franchise requires looking at different paths; a 20% drop in revenue could delay your 2-year payback. This financial feasibility study for franchise business owners helps you stress-test whether the model still works if your client engagement costs spike. Scenarios prepare you for the unexpected.
Finance: update unit break-even and payback model by Friday.
This franchise financial model template is built in Excel, allowing you to tweak every line item to fit your local market. You can adjust the pre-filled formulas and editable assumptions to match your specific territory or operating scenario without needing a degree in finance. It is a plug-and-play tool for non-finance owners.

Planning for the long haul is easier when you see the full picture of your franchise business plan financial projections. This model tracks revenue growth from $555,000 in year one up to nearly $1.4 million by year five, giving you a clear roadmap for scaling your operation. Scaling to $1.3M requires a clear 5-year view.

We have baked in the specific franchise royalty fee structure of 3.56% so you can see exactly how much goes back to the brand. Estimating ongoing royalty payments in business plans is vital because these costs hit your top line before you even pay for office rent or staff. Royalties are a fixed reality of the brand model.

Use the franchise startup cost calculator to map out your initial $112,000 investment, covering everything from the $64,700 franchise fee to office fit-outs. Knowing your break-even analysis for franchises helps you understand that you only need a few retainer clients to cover your fixed monthly overhead. You can't manage what you don't measure.

This tool includes franchise unit performance metrics based on real-world digital marketing standards to help you sanity-check your numbers. This franchise profitability analysis helps you see if your 2% cloud data costs or your subcontractor fees are in line with what other high-performing units see in the field. Benchmarks keep your assumptions grounded in reality.


Simply purchase and download the financial model template, then access it instantly using Microsoft Excel or Google Sheets. No installation or technical expertise required-just open and start working.

Enter your business-specific numbers, including revenue projections, costs, and investment details. The pre-built formulas will automatically calculate financial insights, saving you time and effort.

Leverage the investor-ready format to confidently showcase your financial projections to banks, franchise representatives, or investors. Impress stakeholders with clear, data-driven insights and professional reports.

Leverage the investor-ready format to confidently present your projections to banks, franchise representatives, or investors.