
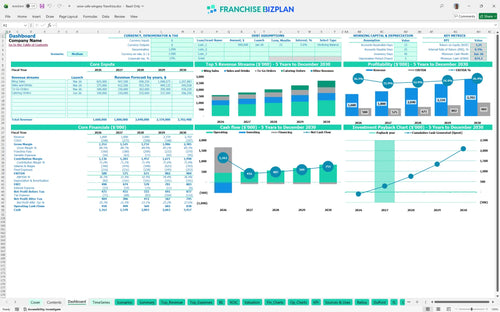
All-in-one Dashboard
Core inputs and core outputs


This franchise financial model template provides a complete pro forma toolkit, including dynamic calculators for startup costs, five-year revenue forecasting, and detailed operational cost breakdowns for wing restaurants.
Core inputs and core outputs
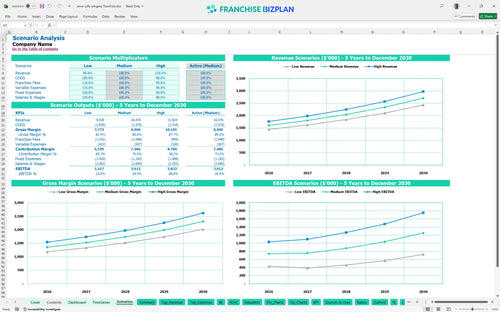
Three scenario analysis
Presentation ready
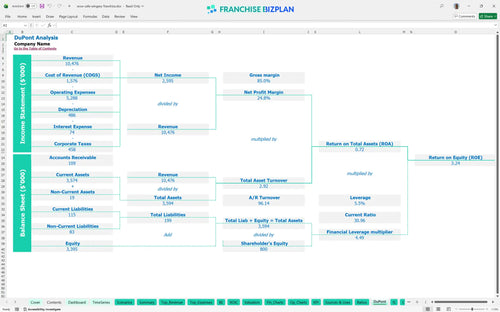
DuPont analysis
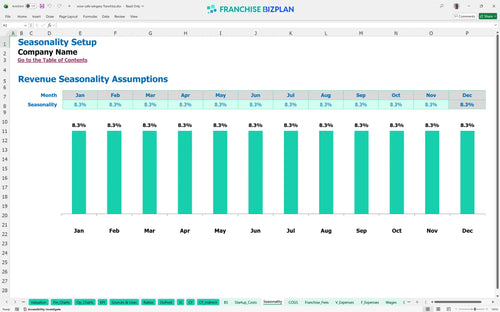
Researched revenue assumptions
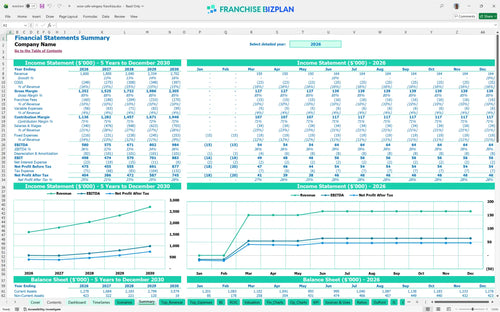
Lender-friendly financial outputs
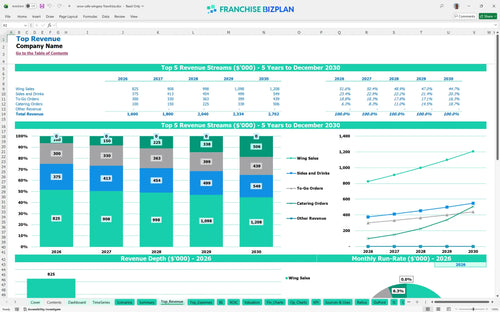
Revenue stream detailed view
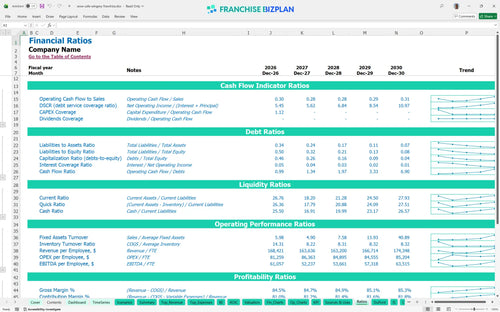
Performance metrics benchmark
We built this wing restaurant profit analysis using deep research into fast-casual economics and specific brand standards. The model comes pre-loaded with $1.6 million in Year 1 revenue assumptions and a $505,000 capital expenditure plan, all of which you can edit to match your local rent and labor market. This tool is designed to provide a realistic financial planning guide for new franchise owners who need to see the math before they sign.
This unit is projected to reach profitability in March 2026, just three months after launch. By Year 1, you are looking at an EBITDA of $580,000 after accounting for 10% in franchise-related fees and $150,000 in annual rent. The quick ramp-up is driven by high-volume wing sales and a lean 13.5% food cost model.
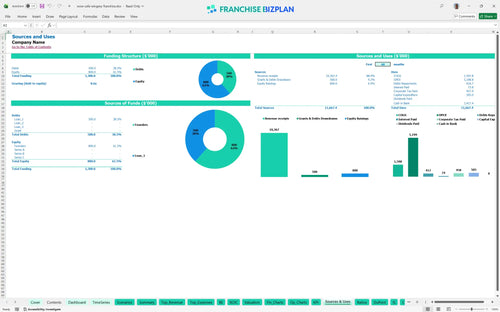
The total franchise unit startup costs are estimated at $505,000 for the initial build-out and fees. This includes the $35,000 franchise fee and $250,000 for leasehold improvements to secure a prime location. You should also account for the $874,000 minimum cash requirement to ensure you have enough liquidity during the first six months of operations.
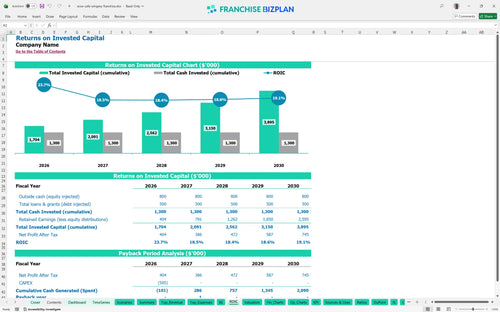
Investors can expect an Internal Rate of Return (IRR) of 9.33% with a full payback period of 2 years. This rapid recovery of the initial $505,000 investment is possible due to strong Year 1 cash flows and a healthy 3.24 Return on Equity (ROE). Calculating return on investment for franchise locations is built into the core of this spreadsheet.
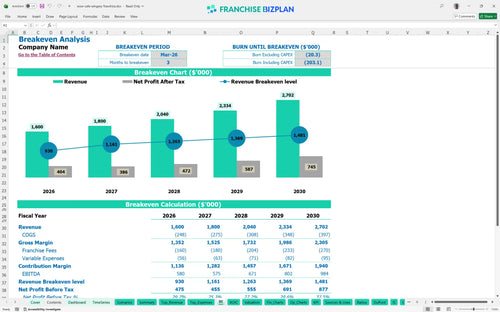
The break-even analysis shows the unit covers all fixed and variable costs by month three. With fixed expenses like $12,500 for rent and $2,200 for utilities, the main driver for hitting break-even is maintaining a steady volume of wing and to-go orders. Estimating profitability for a new wing franchise unit requires keeping a close eye on these fixed monthly burdens.
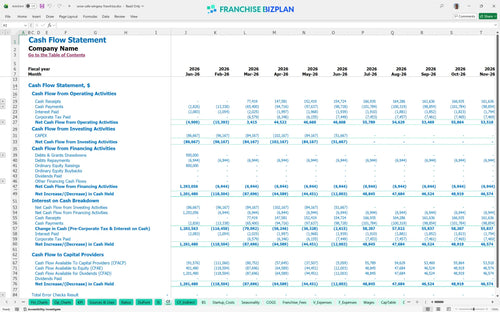
The lowest cash point is projected for June 2026, with a minimum cash balance of $874,000. This provides a significant safety net for the franchisee during the initial ramp-up of catering and service staff hiring. This franchising financial projection spreadsheet ensures you don't run out of fuel while waiting for your Year 2 revenue growth to $1.8 million.
The model compares Low, Medium, and High scenarios to show how a 10% dip in wing sales or a spike in food ingredients affects your IRR. In the High case, aggressive catering growth can push Year 1 EBITDA well past $580,000, while the Low case might extend your payback period by several months. It is defintely better to stress-test these variables before committing capital.
This franchise financial model template is a flexible Excel tool designed for high-stakes decision-making. You can adjust every variable, from wing prices to kitchen labor hours, ensuring the math reflects your specific territory and local market conditions. It defintely removes the guesswork by providing a structured environment where pre-filled formulas handle the heavy lifting of complex restaurant revenue forecasting.

Long-term success in the fast-casual space requires looking past the grand opening. This model delivers a 5-year roadmap, showing revenue climbing from $1.6 million in year one to over $2.7 million by year five. These pro forma financial statements for franchise business owners help you visualize how scaling catering and to-go orders impacts your long-term store-level margin and cash flow.

Franchise royalty fees and marketing contributions are non-negotiable top-line hits that can squeeze margins if not planned correctly. This model tracks the 8% royalty and 2% brand fund fee against your monthly sales, so you see exactly how much goes to the franchisor. By accounting for the $35,000 initial fee upfront, you get a transparent view of your true operational cost breakdown for wing restaurants.

Knowing how to calculate startup costs for a restaurant franchise is the difference between a smooth launch and a mid-build-out cash crunch. The model aggregates your $250,000 leasehold improvements and $130,000 equipment package to define your total entry cost. This break-even analysis identifies the exact month you stop burning cash and start generating a return, which is projected at month three for this unit.

This financial model template for fast casual restaurant operators uses realistic benchmarks to keep your plan grounded. With food costs set at 13.5% and rent at $12,500 monthly, you can compare your expected performance against industry standards. These guardrails help you sanity-check your staffing levels and occupancy costs before you sign a lease or hire your first manager.


Simply purchase and download the financial model template, then access it instantly using Microsoft Excel or Google Sheets. No installation or technical expertise required-just open and start working.

Enter your business-specific numbers, including revenue projections, costs, and investment details. The pre-built formulas will automatically calculate financial insights, saving you time and effort.

Leverage the investor-ready format to confidently showcase your financial projections to banks, franchise representatives, or investors. Impress stakeholders with clear, data-driven insights and professional reports.

Leverage the investor-ready format to confidently present your projections to banks, franchise representatives, or investors.