
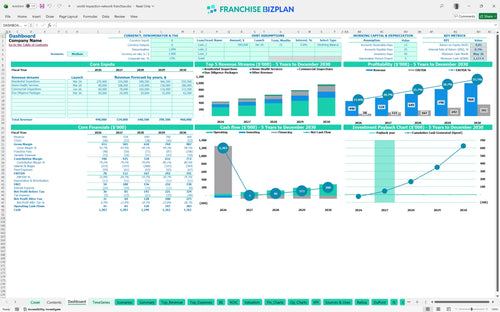
All-in-one Dashboard
Core inputs and core outputs


This comprehensive financial projection model for property inspection business includes everything from dynamic revenue drivers and payroll scaling to automated cash flow statements and ROI calculators.
Core inputs and core outputs
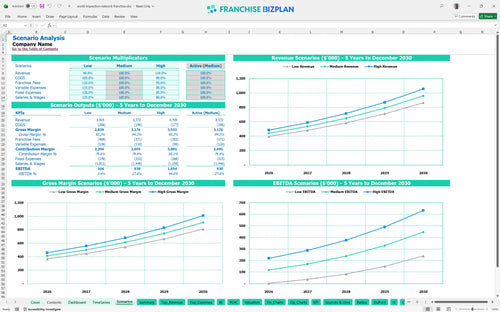
Three scenario analysis
Presentation ready
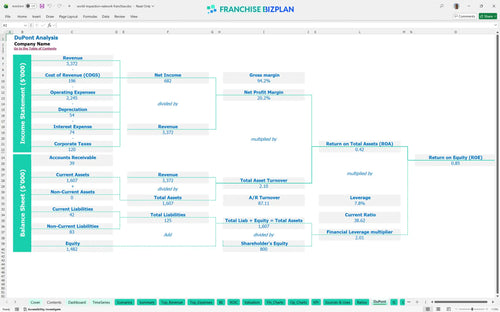
DuPont analysis
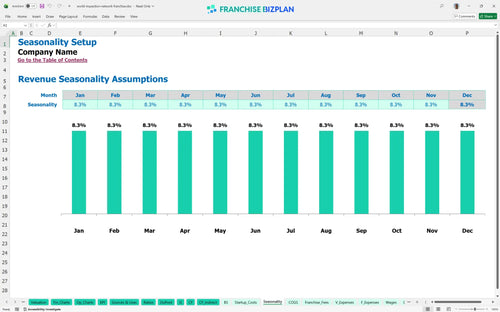
Researched revenue assumptions
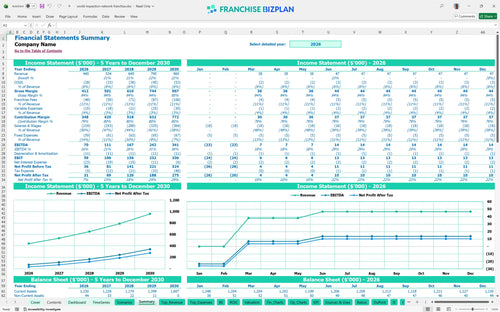
Lender-friendly financial outputs
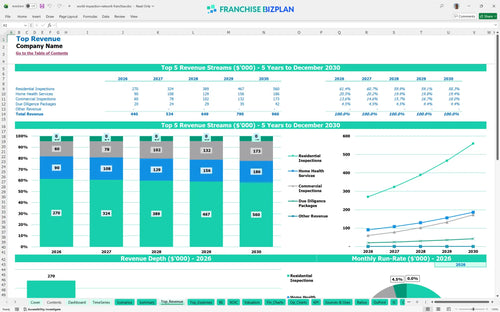
Revenue stream detailed view
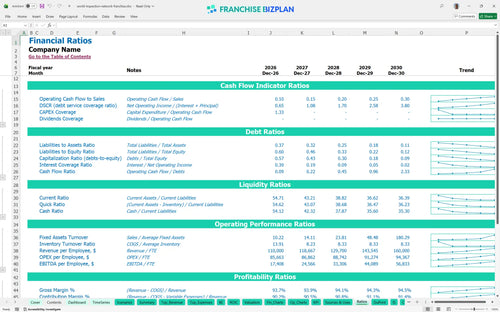
Performance metrics benchmark
We built this franchise unit financial model using our own research into the property inspection sector. Key assumptions, including the $440,000 Year 1 revenue target and $70,000 initial EBITDA, are pre-populated and fully editable to match your specific territory. This tool helps you visualize how staffing four different positions and managing a $2,800 monthly rent impacts your bottom line from day one.
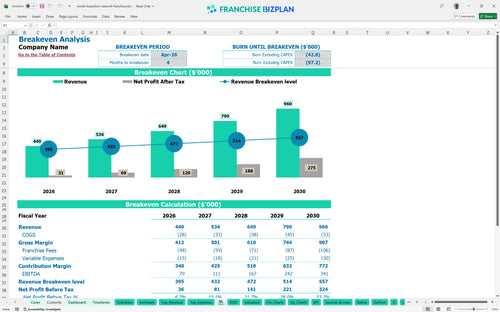
This franchise unit is projected to reach profitability very quickly, with a breakeven date of April 2026. After accounting for the 7% royalty and 4% marketing fees, the model shows EBITDA growing from $70,000 in the first year to $341,000 by year five. Here's the quick math: your net profit scales as you add field inspectors and increase high-margin home health services.
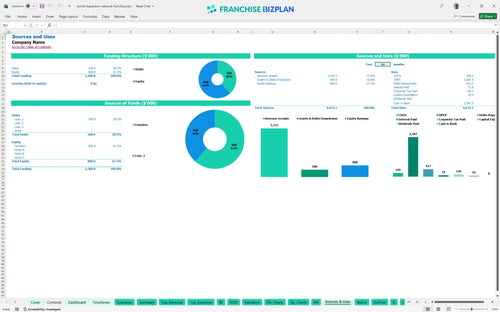
Launching this unit in the US requires a focused initial investment, primarily centered on the $22,000 franchise fee and mobile infrastructure. Your total startup capital covers everything from $12,000 for fleet vehicles to $4,500 for specialized infrared cameras. Plus, the model accounts for a significant cash buffer to handle the four-month ramp-up period before reaching break-even.
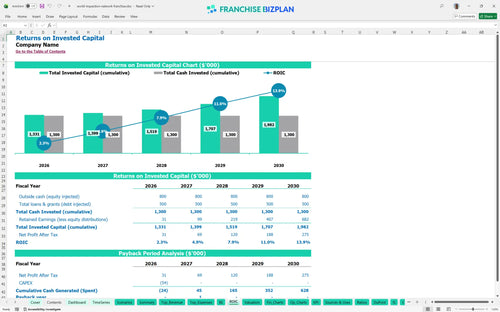
Investors can expect a solid return with an Internal Rate of Return (IRR) of 8.3% and a Return on Equity (ROE) of 0.85. The small business franchise financial planning spreadsheet estimates a payback period of just 2 years, which is quite fast for a service-based model. This ROI is driven by the relatively low CAPEX compared to the $960,000 revenue potential in year five.
The monthly break-even point is reached in just 4 months, provided you hit your initial residential inspection targets. The biggest driver for reaching this point is the volume of $180,000 in residential inspections in year one, which covers the $4,950 in monthly fixed costs like rent and insurance. If your inspector productivity lags, the break-even point will shift later into the year.
The lowest cash point occurs in May 2026, with a minimum cash balance of $1,177,000 (including initial funding). You need to maintain a tight grip on cash during the first quarter to ensure you can cover the $110,000+ in combined salaries for the Operations Manager and Lead Inspector. Still, the property inspection franchise ROI calculator shows that once you clear the ramp-up, cash flow stabilizes defintely fast.
Our building a financial model for a new franchise location includes Low, Medium, and High scenarios to show how a 10% shift in volume changes your outcome. In the High case, aggressive local marketing pushes Year 1 revenue past $440,000, significantly increasing your 15.9% Year 1 EBITDA margin. The Low case warns you that if inspections drop, the fixed $2,800 rent and $60,000 manager salary will pressure your peak cash needs.
Finance: update unit break-even and payback model by Friday
This home inspection franchise financial model is built entirely in Excel, giving you total control over the numbers. Every formula is open and every assumption-from local inspector wages to specific territory marketing spend-is fully editable so you can adapt it to your specific market. Honestly, a pre-written Excel model for franchise owners is the only way to defintely stress-test your assumptions before signing a lease.

Planning for a property inspection business plan requires looking past the first year of inspections. This model provides a detailed 5-year outlook, showing how revenue can scale from $440,000 in Year 1 to $960,000 by Year 5. It maps out your long-term profitability and cash flow, helping you see the transition from a single-inspector setup to a multi-inspector operation with shared overhead.

Franchise-specific costs can eat your margin if you don't track them precisely. This franchise unit financial template automatically calculates the 7% royalty and 4% marketing fund contribution based on your monthly revenue. By baking these franchise royalty fees into your financial forecasting, you get a realistic view of your store-level EBITDA after the franchisor takes their cut.

Knowing how to calculate startup costs for a home inspection franchise is critical for managing your initial liquidity. The model breaks down your total investment, including the $22,000 franchise fee and $12,000 for fleet vehicles, to determine your exact break-even analysis. You will see exactly what sales volume you need to cover your $2,800 monthly rent and $4,950 total fixed monthly overhead.

We have integrated unit economics and industry benchmarks to help you sanity-check your inspection business profit calculator. For example, lab testing fees are modeled to start at 4.5% and improve to 3.7% as you gain volume. These benchmarks allow you to compare your projected labor costs and gross margins against typical residential inspection franchise revenue forecasting standards.


Simply purchase and download the financial model template, then access it instantly using Microsoft Excel or Google Sheets. No installation or technical expertise required-just open and start working.

Enter your business-specific numbers, including revenue projections, costs, and investment details. The pre-built formulas will automatically calculate financial insights, saving you time and effort.

Leverage the investor-ready format to confidently showcase your financial projections to banks, franchise representatives, or investors. Impress stakeholders with clear, data-driven insights and professional reports.

Leverage the investor-ready format to confidently present your projections to banks, franchise representatives, or investors.