

All-in-one Dashboard
Core inputs and core outputs


This comprehensive template provides a ready-to-use Excel framework for analyzing startup capital, five-year profitability, and monthly cash flow for a large-scale fitness facility.
Core inputs and core outputs

Three scenario analysis

Presentation ready

DuPont analysis

Researched revenue assumptions

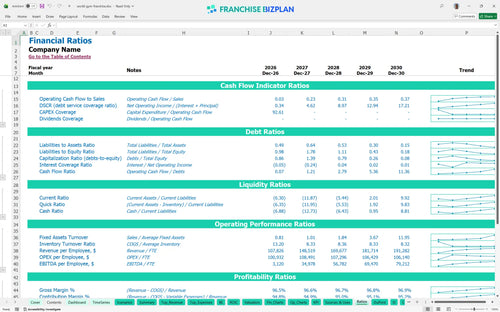
Lender-friendly financial outputs

Revenue stream detailed view
Performance metrics benchmark
We built this model using detailed research on large-scale fitness center startup costs and operational realities. The pre-populated data covers everything from $2.75 million in capital expenditure planning for fitness center assets to specific revenue drivers like corporate wellness program financial projections. You can use these researched figures as a baseline or overwrite them with your own local quotes to create a custom fitness franchise investment feasibility study.
The model shows this unit reaches a positive EBITDA of $36,000 in its first year, but true net profitability depends on clearing the initial $2.75 million investment. With revenue scaling from $1.24 million to $3.73 million by year five, the unit becomes a cash-flow engine as it matures. Here is the quick math: you hit the break-even point in June 2026, just six months after the initial launch phase.
You will need approximately $2.75 million in franchise startup capital to get the doors open and cover the initial ramp-up. This includes the $25,000 franchise fee, a massive $1.2 million for leasehold improvements, and $900,000 for strength and cardio equipment. The model also accounts for a significant cash buffer, as the lowest cash point hits a deficit of $1.61 million during the construction and early member acquisition phase in 2026.
The franchise ROI calculator indicates an Internal Rate of Return (IRR) of 0.81% and a Return on Equity (ROE) of 1.36 over the first five years. While the EBITDA grows to a healthy $1.54 million by year five, the heavy initial CAPEX means full payback occurs after the fifth year of operation. This is a long-term play focused on asset appreciation and high-volume cash flow rather than a quick flip.

The unit hits its monthly break-even point in June 2026, roughly six months after the project starts. This assumes you hit your year-one revenue target of $1.24 million and keep a tight lid on the $35,000 monthly facility rent. The biggest threat to this timeline is a slow ramp-up in individual memberships, which are the primary driver of the $550,000 in year-one base revenue.

Your lowest cash point is June 2026, where the cumulative deficit reaches $1.61 million before the business starts generating enough monthly surplus to pay back the investment. You need enough liquidity or financing to cover the $2.75 million in startup costs plus this operational burn. If your build-out takes 60 days longer than planned, that cash hole will deepen, so a 15% contingency fund is highly recommended.

The difference between a 'High' and 'Low' case in this gym revenue forecasting model is massive due to high fixed costs like the $420,000 annual rent. In a high-performance scenario where you hit the $3.73 million revenue mark by year five, your EBITDA margin expands significantly because your rent and management software costs stay flat. A 10% drop in membership retention in year one can delay your break-even point by several months and increase your peak cash need.
Finance: update unit break-even and payback model by Friday
This gym franchise financial model is a fully editable Excel tool designed for high-intensity planning. You can swap out every assumption, from membership pricing to local utility rates, ensuring the math matches your specific territory. Since the formulas are pre-built, you won't spend hours debugging cells; instead, you focus on how different staffing levels or equipment leases change your bottom line. It is a flexible gym franchise business plan template that adapts as your site selection or build-out costs shift during the planning phase.

Planning a health club investment analysis requires a long-term view because the heavy upfront costs take time to recover. This model provides a detailed 5-year franchise unit financial projection, mapping out the climb from $1.24 million in year one revenue to over $3.7 million by year five. You get a clear look at how scaling your membership base and adding recovery services impacts your fitness business EBITDA over sixty months. It defintely helps you see the gap between opening day and reaching a mature, stabilized state.

The gym franchise royalty and fee structure template is baked into the model to ensure you never overlook the franchisor's cut. At a 5% royalty and 2% marketing fee, you are looking at 7% of gross sales leaving the business before you pay rent or staff. We have structured the logic to calculate these fees automatically based on your projected revenue streams, including individual memberships and corporate wellness deals. This level of detail is vital for a realistic projected profit and loss for gym franchise operations.

Understanding how to calculate gym franchise startup costs is the first step in avoiding a mid-project cash crunch. This model aggregates everything from the $25,000 franchise fee to the $1.2 million leasehold improvement budget to show your total entry price. The break-even analysis for gym franchise units then identifies the exact month when your monthly revenue finally covers your $35,000 rent and other fixed costs. It is a reality check on how much volume you need to stop the bleeding and start building equity.

We have integrated benchmarks into this financial model template for fitness studio franchise units so you can see if your costs are out of whack. For instance, if your laundry and towel costs exceed 2.5% of revenue, the model helps you spot that inefficiency quickly. You can compare your labor spend against the $85,000 general manager salary and other staffing targets to ensure your operating expense budget for luxury gym standards remains competitive. It is about sanity-checking your numbers against real-world fitness industry averages.


Simply purchase and download the financial model template, then access it instantly using Microsoft Excel or Google Sheets. No installation or technical expertise required-just open and start working.

Enter your business-specific numbers, including revenue projections, costs, and investment details. The pre-built formulas will automatically calculate financial insights, saving you time and effort.

Leverage the investor-ready format to confidently showcase your financial projections to banks, franchise representatives, or investors. Impress stakeholders with clear, data-driven insights and professional reports.

Leverage the investor-ready format to confidently present your projections to banks, franchise representatives, or investors.