


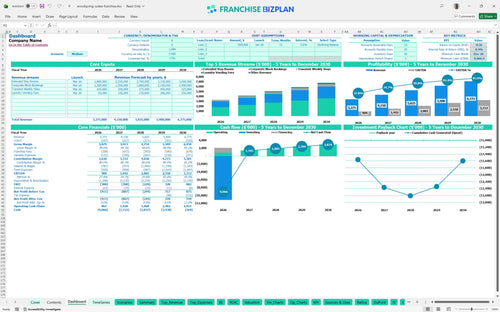
All-in-one Dashboard
Core inputs and core outputs



This comprehensive commercial real estate franchise investment model includes detailed CAPEX schedules, staffing plans, and multi-year P&L statements to guide your development process.
Core inputs and core outputs
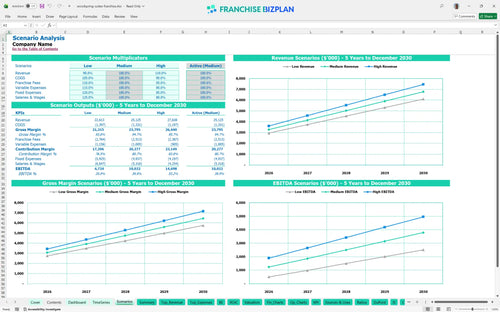
Three scenario analysis
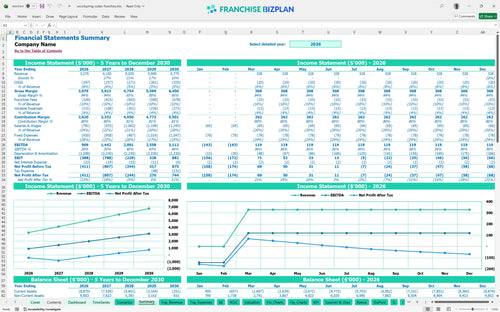
Presentation ready
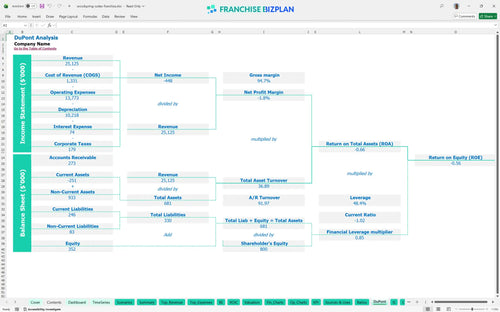
DuPont analysis
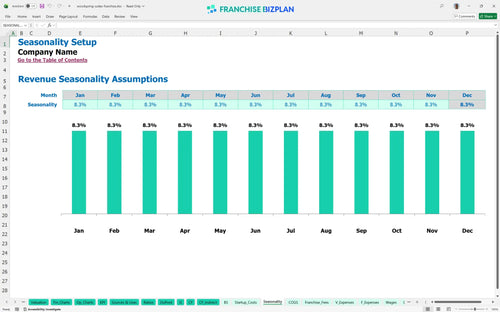
Researched revenue assumptions
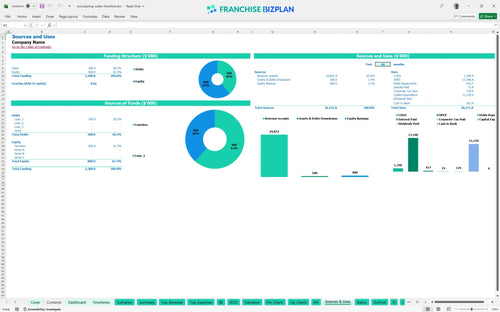
Lender-friendly financial outputs
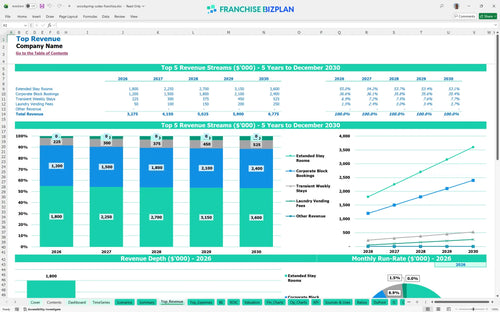
Revenue stream detailed view
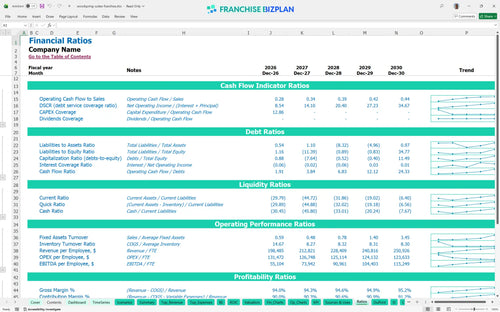
Performance metrics benchmark
We built this franchise unit financial model using our own research into the extended stay market. Key assumptions, including the $1.2M initial room revenue and 10% total franchise fees, are pre-populated with researched data specific to this franchise unit and are fully editable. Honestly, seeing a $909k EBITDA in year one helps you see the potential of this workforce housing play without the usual guesswork.
The unit hits operational profitability quickly, with a break-even date of April 2026. While year-one EBITDA is strong at $909,000, the high initial construction costs mean you are playing a long game for full capital recovery. Still, by year five, EBITDA is projected to reach $3.11M as your corporate block bookings mature.
You will need a significant capital stack to launch this unit in the US, with total CAPEX exceeding $11M. This includes the $50,000 franchise fee, $7M for building construction, and $1.5M for suite kitchen appliances. Here's the quick math: construction and kitchens alone make up over 75% of your initial cash out.
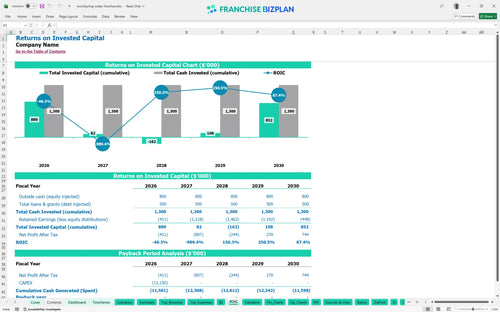
With an IRR of -0.44% over the first five years, this is defintely a long-term commercial property pro forma play. The model shows you won't hit full payback within the first 60 months, but the steady climb in net operating income suggests significant enterprise value for a multi-unit operator.
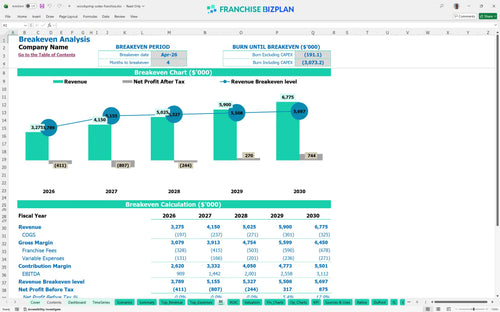
You reach the monthly break-even point in just 4 months, by April 2026. The biggest driver here is your corporate block bookings, which must offset the $79,000 in monthly fixed costs like ground lease rent and property taxes. If occupancy lags, the high fixed cost of the ground lease creates immediate pressure.
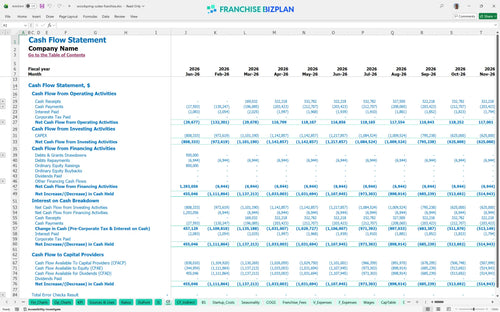
Your lowest cash point hits in December 2026 at negative $9.06M, assuming you are financing the build-out. You will need a solid credit line or equity partner to bridge the gap between construction starts and the ramp-up of laundry vending fees and room revenue. Plus, a 10% cash buffer is recommended to handle any construction delays.
A high-case scenario assumes you nail the revenue management strategy for extended stay hotels, pushing past the $3.27M year-one target. If occupancy drops in a low-case scenario, the 10% combined royalty and marketing fee becomes a heavy anchor. The model shows that a 10% revenue drop can delay your break-even by several months.
This extended stay hotel franchise financial model is built in Excel, so you can tweak every variable to fit your market. We have pre-filled the formulas and editable assumptions, making it simple to adapt the template to your specific site, local labor rates, and operating scenario without starting from scratch.

Planning for a hospitality business financial template requires a long-term view of performance and capital recovery. This model provides detailed 5-year revenue, cost, and cash flow projections, showing how your unit scales from a $3.27M year-one start to over $6.7M in annual revenue by year five.

We built this model to capture the specific financial obligations of the brand, including the $50,000 initial franchise fee and ongoing 5% royalty payments. By including the 5% brand marketing fund contribution, you can see the real economics of the unit after all corporate obligations are met.

Our franchise unit startup cost calculator maps out the total initial investment, including the $7M construction and $1.5M kitchen equipment costs. It helps you identify the exact sales level required to cover your $45,000 monthly ground lease and other fixed operating expenses.

The model incorporates built-in industry benchmarks for key metrics like housekeeping supplies and utility costs to help you sanity-check your numbers. Comparing your projected 3.8% supply cost against typical ranges ensures your hotel franchise profitability analysis stays grounded in reality.


Simply purchase and download the financial model template, then access it instantly using Microsoft Excel or Google Sheets. No installation or technical expertise required-just open and start working.

Enter your business-specific numbers, including revenue projections, costs, and investment details. The pre-built formulas will automatically calculate financial insights, saving you time and effort.

Leverage the investor-ready format to confidently showcase your financial projections to banks, franchise representatives, or investors. Impress stakeholders with clear, data-driven insights and professional reports.

Leverage the investor-ready format to confidently present your projections to banks, franchise representatives, or investors.