

All-in-one Dashboard
Core inputs and core outputs


This comprehensive toolkit provides a pro forma income statement, cash flow tracker, and CAPEX schedule specifically tuned for high-end wellness operations.
Core inputs and core outputs
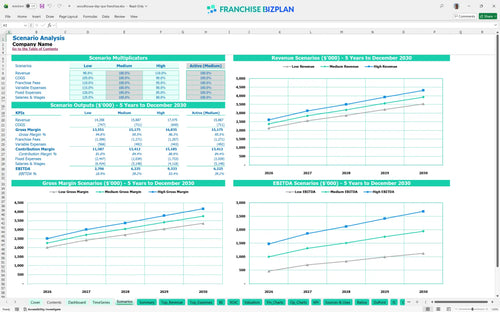
Three scenario analysis
Presentation ready
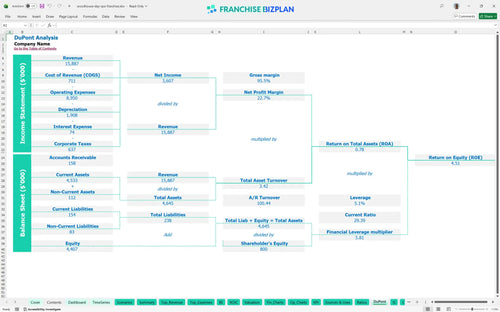
DuPont analysis
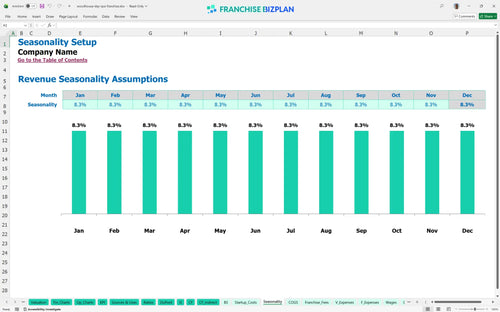
Researched revenue assumptions
Lender-friendly financial outputs
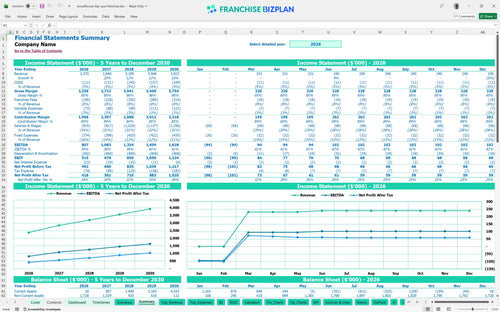
Revenue stream detailed view
Performance metrics benchmark
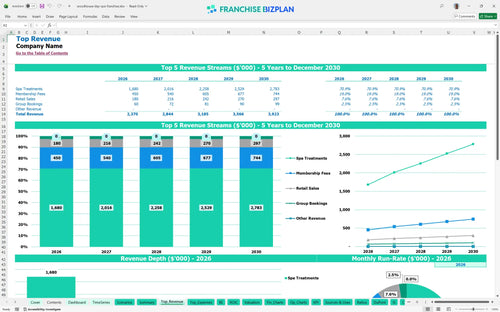
We built this franchise investment analysis using detailed research on luxury wellness units. Key assumptions like the $60,000 franchise fee, $850,000 leasehold improvements, and tiered membership revenue are pre-populated and fully editable. This model helps you visualize how $2.37M in year-one revenue translates into store-level profit.
The unit reaches profitability defintely within the first year, showing a year-one EBITDA of $807,000. By year five, as the membership base matures and therapist utilization stabilizes, annual EBITDA is projected to climb to $1.62M. Profitability depends on maintaining high-margin retail sales and consistent group bookings.
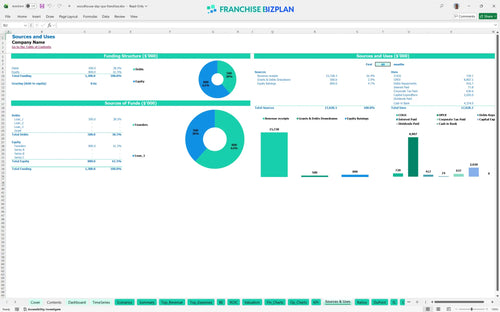
You need approximately $2.02M in total CAPEX to launch this unit in a prime US retail corridor. This covers everything from the initial $60,000 fee to the $200,000 signature quiet room construction. You should also account for the $543,000 minimum cash dip projected during the ramp-up phase in 2026.
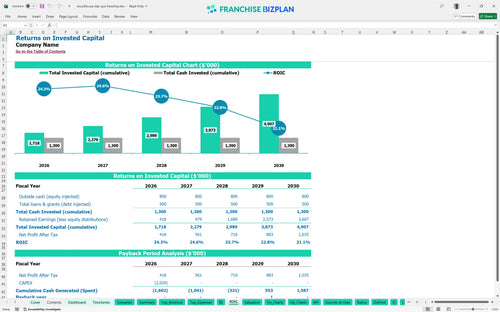
The model projects an Internal Rate of Return of 4.01% and a Return on Equity of 4.51% over the initial five-year period. The total payback period is estimated at 4 years, which is standard for high-CAPEX luxury retail. Here is the quick math: steady revenue growth is the primary driver for these investor returns.
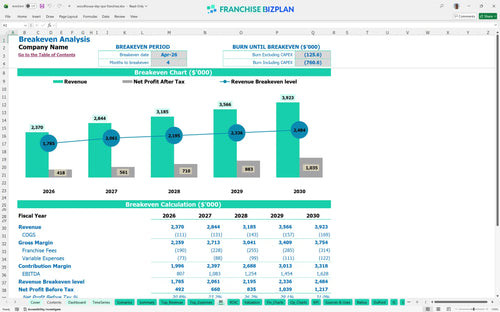
The unit is projected to hit its monthly break-even point in April 2026, just 4 months after launch. The biggest hurdle to break-even is the $22,000 monthly rent and the $105,000 director salary. You must maintain high service volume early on to cover these heavy fixed costs and the 8% total franchise fee burden.
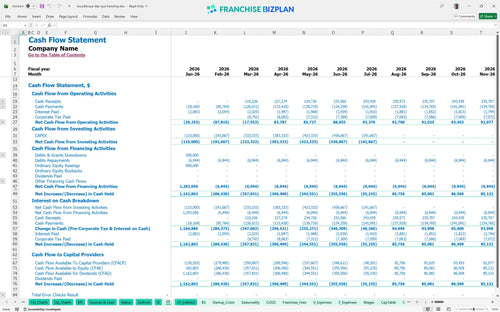
Your lowest cash point occurs in July 2026 at negative $543,000, representing the peak of your working capital strain. You need a sufficient cash buffer to handle the gap between construction outflows and membership dues. Managing the timing of your $500,000 equipment payments is critical to protecting your liquidity.
The High scenario assumes faster therapist hiring and higher membership retention, significantly shortening the 4-year payback. A Low scenario, where revenue stays at the $2.37M year-one level longer, would increase the peak cash need and delay profitability. Scenarios help you stress-test your $185,000 monthly payroll commitment.
Finance: update unit break-even and payback model by Friday.
This franchise financial model template is a flexible Excel tool designed for precision. You can adjust pre-filled formulas and editable assumptions to match your specific territory, local labor rates, and lease terms. It simplifies complex projections so you can focus on operational reality rather than spreadsheet math.

Plan your long-term growth with a detailed spa business plan template that forecasts five years of performance. The model tracks revenue scaling from $2.37M in year one to over $3.9M by year five. It provides a clear view of cash flow and net profit to help you manage multi-unit expansion or single-unit stability.

This tool automates the calculation of your ongoing obligations to the franchisor. It factors in the 6% royalty fee and 2% marketing fund contribution against your monthly gross sales. Understanding these 'off-the-top' costs is vital for calculating your true store-level EBITDA and bottom-line cash flow.

Use this franchise startup cost calculator to map out your initial $2.02M capital requirement. The model identifies the exact sales volume needed to cover your $22,000 monthly rent and high-end labor costs. It translates abstract investment numbers into a concrete daily traffic target for your front-desk team.

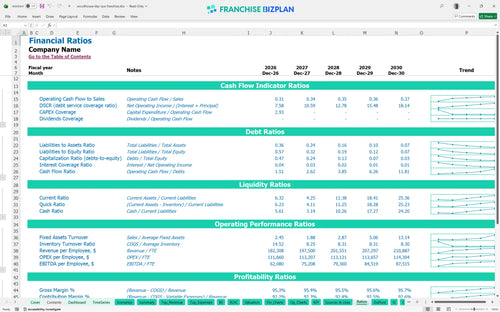
Sanity-check your day spa business model against researched industry standards. The template includes benchmarks for therapist wages and retail product costs, which stay around 1.2% of revenue. Comparing your projected margins to these norms helps identify potential 'margin leaks' before you sign a long-term lease.


Simply purchase and download the financial model template, then access it instantly using Microsoft Excel or Google Sheets. No installation or technical expertise required-just open and start working.

Enter your business-specific numbers, including revenue projections, costs, and investment details. The pre-built formulas will automatically calculate financial insights, saving you time and effort.

Leverage the investor-ready format to confidently showcase your financial projections to banks, franchise representatives, or investors. Impress stakeholders with clear, data-driven insights and professional reports.

Leverage the investor-ready format to confidently present your projections to banks, franchise representatives, or investors.