
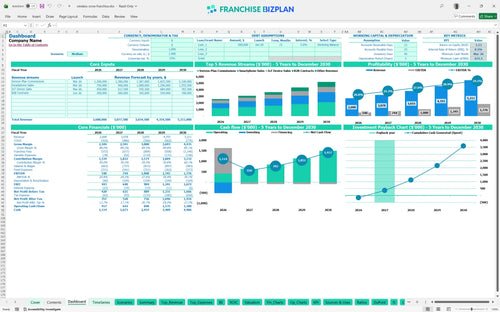
All-in-one Dashboard
Core inputs and core outputs


This financial model template for cellular service retail stores provides a complete Excel-based toolkit to project revenue, manage high royalties, and track the ROI of a $520,000 initial investment.
Core inputs and core outputs
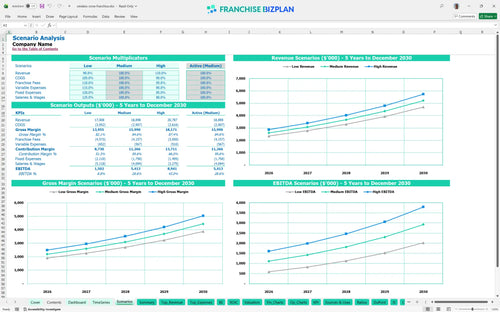
Three scenario analysis
Presentation ready
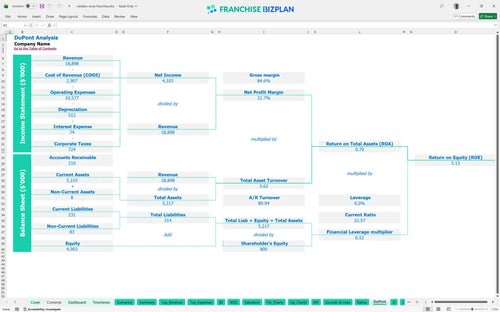
DuPont analysis
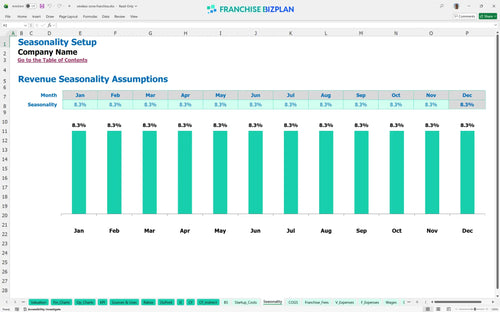
Researched revenue assumptions
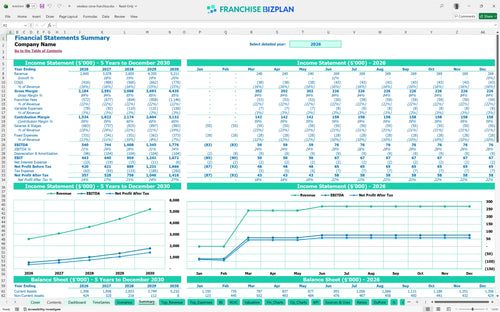
Lender-friendly financial outputs
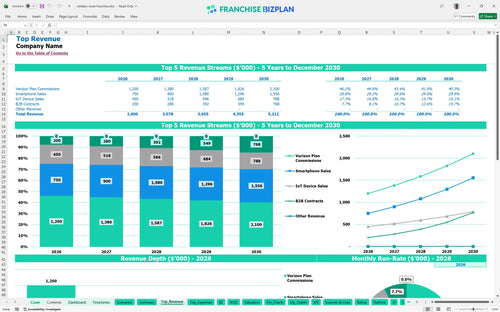
Revenue stream detailed view
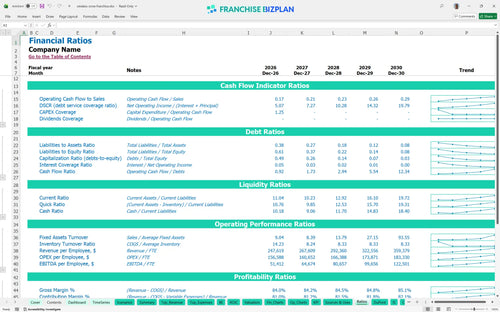
Performance metrics benchmark
We built this wireless retail store business model spreadsheet using deep research into the cellular retail sector. Key assumptions like the 22% royalty fee, $20,000 monthly prime rent, and a $2.6 million year-one revenue target are pre-populated and ready for your local adjustments. This model is designed to show you exactly how a 2-year payback period is achievable if you hit your B2B and smartphone sales targets.
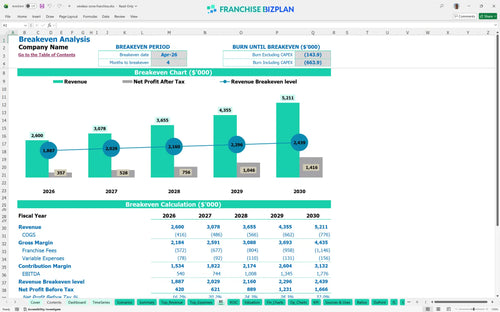
The unit reaches its break-even point in April 2026, just four months after the doors open. With a year-one EBITDA of $540,000, you move into the black quickly, provided you manage the high 14% hardware procurement costs and 22% royalty burden. Still, the real profit acceleration happens in years three through five as B2B contracts scale toward $768,000 annually.
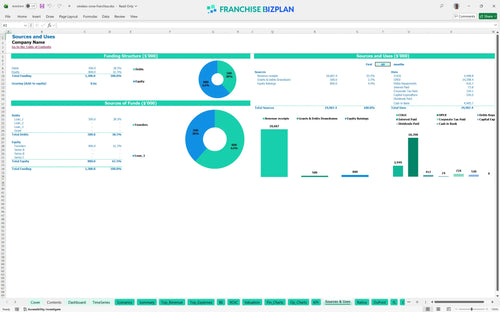
You will need $520,000 to get this unit off the ground in the US market. This total investment covers the $25,000 franchise fee, $200,000 for leasehold improvements, and $100,000 for your initial inventory. The model also accounts for $50,000 in POS and IT equipment to ensure your tech-forward family customers get the high-touch experience they expect.
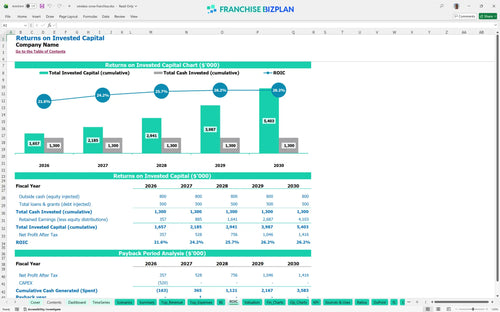
The franchise investment return calculator shows an Internal Rate of Return (IRR) of 8.52% and a Return on Equity (ROE) of 5.13%. You can expect a full payback of your initial capital within 2 years, which is strong for a retail storefront with high upfront build-out costs. What this estimate hides is that your return defintely depends on maintaining a high average ticket through IoT and accessory upsells.
Monthly break-even is achieved when revenue covers the $27,600 in fixed monthly costs, including the $20,000 prime location rent. The 22% royalty is the most significant variable lever; if sales volume dips, that fixed-cost percentage climbs fast. To hit break-even by month four, you must focus on high-margin activations and immediate B2B outreach.
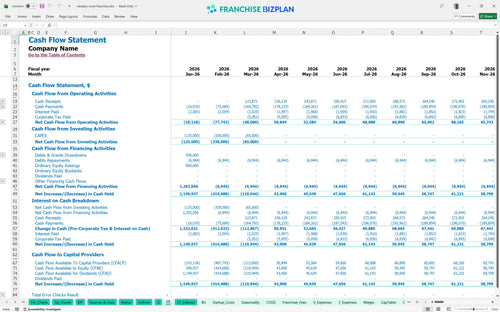
The lowest cash point occurs in March 2026, with a minimum cash balance of $615,000. You need at least four months of runway to bridge the gap between your January build-out start and the April break-even date. If your leasehold improvements take 30 days longer than planned, your working capital pressure will rise, so keep a buffer for those pre-opening weeks.
In a High scenario where you hit $5.2 million in revenue by year five, your EBITDA jumps to $1.77 million. However, a Low scenario with weak B2B contract growth would significantly delay your 2-year payback. The model shows that even a 2-point shift in hardware procurement costs can swing your year-one margin by tens of thousands of dollars.
This franchise unit financial model template is built in Excel to give you total control over your wireless store financial projections. You can adjust every pre-filled formula and assumption to match your specific territory, whether you are looking at a high-traffic lifestyle center or a standalone retail spot. It is a flexible franchise startup cost calculator that lets you swap out rent, labor rates, and local demand figures on the fly.

Planning for a retail franchise business plan requires looking past the grand opening to see how the unit scales over time. This model delivers detailed 5-year projections, showing revenue growing from $2.6 million in year one to over $5.2 million by year five. It maps out the long-term profitability analysis you need to satisfy lenders and your own internal growth targets. Plus, it tracks how your margin evolves as B2B contracts and IoT sales become a larger part of the mix.

Operating a cellular retail store means managing specific brand obligations that can eat into your store-level margin. This model includes a clear franchise fee breakdown, accounting for the $25,000 initial fee and the ongoing 22% royalty on performance. By tracking these costs alongside your local overhead, you get a realistic view of the cash that actually stays in your pocket after the franchisor takes their cut. Honestly, at a 22% royalty, you have to be precise with your variable cost management to keep the bottom line healthy.

Knowing how to calculate startup costs for a retail franchise is the first step to avoiding a cash crunch. This tool aggregates your $200,000 leasehold improvements, $100,000 in initial inventory, and $80,000 in fixtures to show your total entry price. The break-even point analysis then tells you exactly when your monthly sales will cover your $20,000 rent and $27,000+ in other fixed monthly costs. Here is the quick math: with high hardware costs, your volume needs to hit its stride by month four to stay on track.

We have integrated industry-specific data for mobile technology franchises to help you sanity-check your numbers. You can compare your $460,000+ annual payroll and $240,000 annual rent against typical retail storefront benchmarks. This helps you spot if you are overstaffed or if your occupancy costs are out of line with the projected $2.6 million in starting revenue. Using these benchmarks ensures your financial planning for new franchise unit owners is grounded in reality rather than best-case guesses.


Simply purchase and download the financial model template, then access it instantly using Microsoft Excel or Google Sheets. No installation or technical expertise required-just open and start working.

Enter your business-specific numbers, including revenue projections, costs, and investment details. The pre-built formulas will automatically calculate financial insights, saving you time and effort.

Leverage the investor-ready format to confidently showcase your financial projections to banks, franchise representatives, or investors. Impress stakeholders with clear, data-driven insights and professional reports.

Leverage the investor-ready format to confidently present your projections to banks, franchise representatives, or investors.