
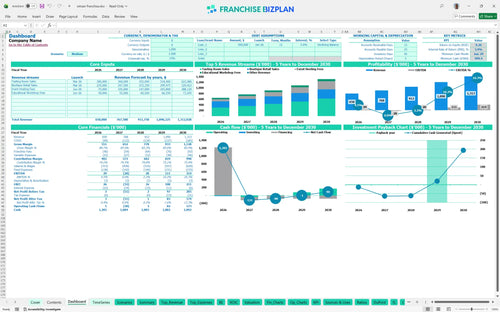
All-in-one Dashboard
Core inputs and core outputs


This comprehensive toolkit provides a dynamic franchise unit profit and loss template, cash flow projections, and ROI calculators specifically tuned for luxury wine and retail operations.
Core inputs and core outputs
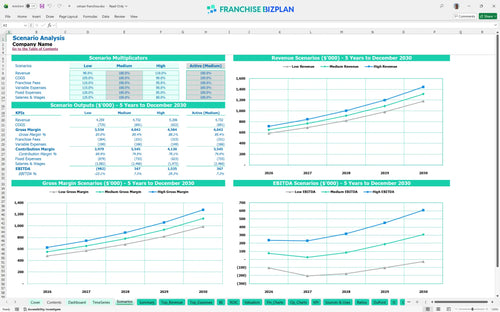
Three scenario analysis
Presentation ready
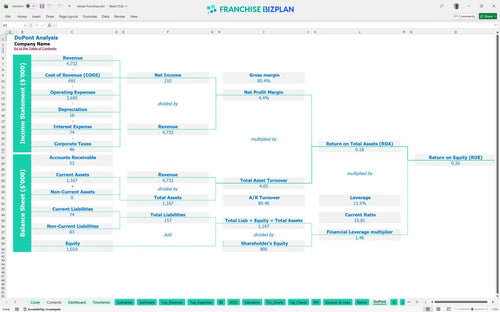
DuPont analysis
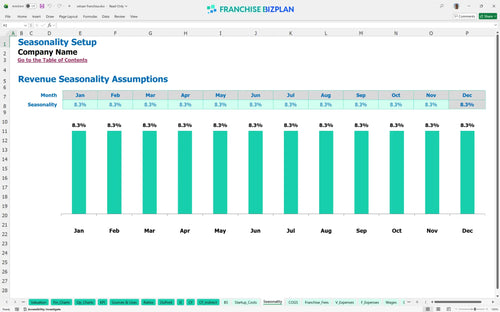
Researched revenue assumptions
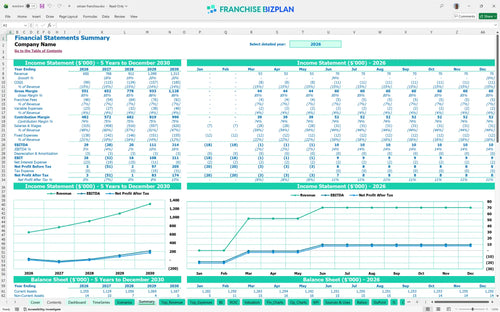
Lender-friendly financial outputs
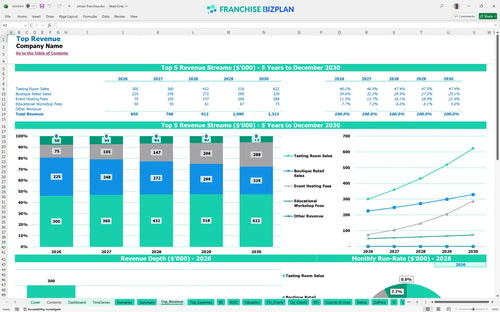
Revenue stream detailed view
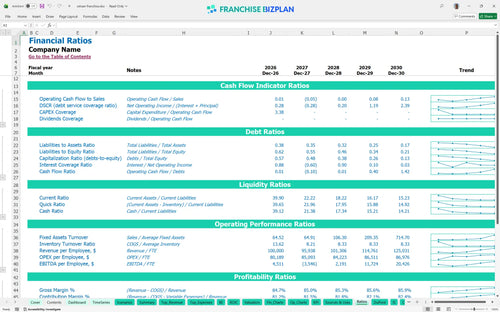
Performance metrics benchmark
We built this franchise unit financial model using our own research into high-end wine and hospitality concepts. Key assumptions, such as the $650,000 year-one revenue target and $8,000 monthly prime location rent, are pre-populated and fully editable. This model provides the specific franchise financial projections for investors needed to secure funding and plan your rollout.
The unit reaches its first positive EBITDA of $29,000 in year one, though it faces a temporary dip in year two before scaling to $214,000 by year five. Profitability is driven by scaling tasting room sales and high-margin event hosting fees as the brand matures. You will defintely need to watch the 6% royalty burden during the year-two dip.
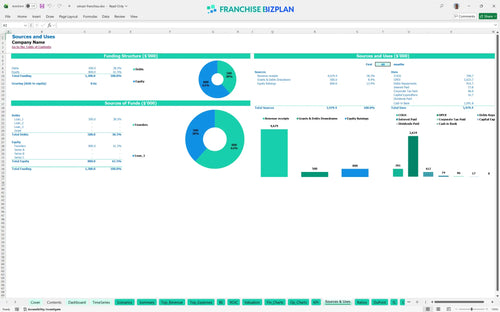
The total initial investment for hard costs is approximately $16,745, covering the franchise fee, $4,000 in leasehold improvements, and wine storage. However, the model accounts for a significant $999,000 minimum cash reserve to handle the luxury ramp-up and operational buffer. This ensures you have the liquidity to survive the early months of restaurant franchise financial forecasting.
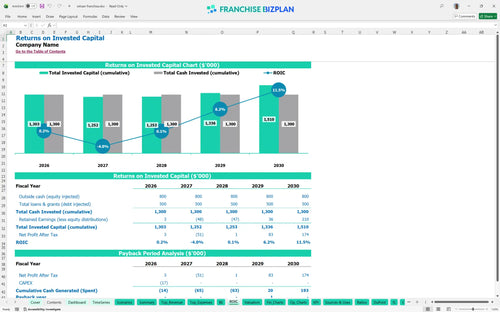
Investors can expect an Internal Rate of Return (IRR) of 3.87% and a Return on Equity (ROE) of 0.26 over the five-year period. The payback period is estimated at 4 years, which is standard for a luxury-focused small business franchise ROI calculator. These metrics reflect a stable, long-term asset rather than a high-risk play.
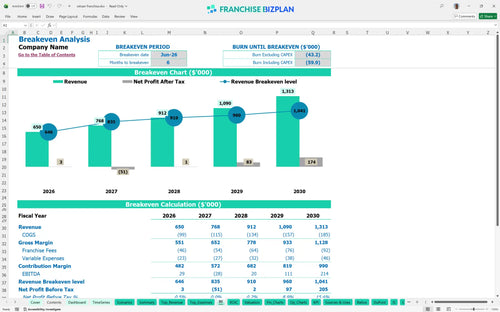
The unit reaches its monthly break-even point in June 2026, just 6 months after the initial launch. To cover the $8,000 rent and $1,500 utilities, the primary driver is throughput in the tasting room and boutique retail volume. This quick break-even is possible due to the low initial franchise investment analysis relative to the high average ticket.
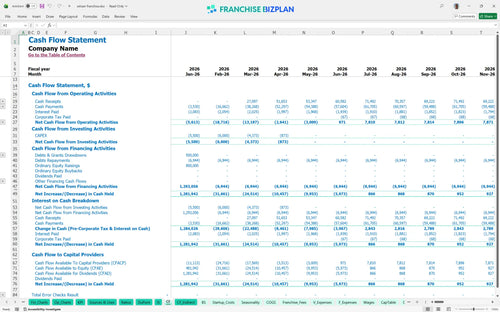
The lowest cash point occurs in January 2029 at $999,000, indicating a very conservative cash management strategy is built into the model. You have a 6-month runway from launch to breakeven, so managing the $277,000+ annual payroll for the manager and sommelier is critical. This helps you evaluate franchise profitability without risking a total cash out.
The model allows you to toggle between Low, Medium, and High scenarios to see how a 10% shift in boutique retail sales impacts your year-one $29,000 EBITDA. High-performance scenarios show a much faster path to the $214,000 year-five profit target by leveraging local marketing execution. Following these steps to analyze franchise operating expenses helps you prepare for any market shift.
This franchise unit financial model is built in Excel with pre-filled formulas and editable assumptions, making it easy to adapt to your specific territory. You can adjust the revenue drivers, staffing levels, and local rent to see how different operating scenarios impact your bottom line. It is a flexible franchise unit financial model excel template designed for real-world stress testing.

Plan for the long term with detailed 5-year revenue, cost, and profit projections tailored for a luxury retail franchise financial model. The tool tracks your growth from $650,000 in year one to over $1.3 million by year five, providing a clear roadmap for cash flow forecasting and capital expenditure planning. This helps you visualize the transition from a single unit to a mature operation.

This model captures specific franchise financial obligations, including the $3,500 initial fee and ongoing 6% royalty payments. By factoring in the 1% brand marketing fund contribution, you can understand the real economics of the brand standards. It ensures you account for every dollar paid to the franchisor before calculating your store-level margin.

Estimate your total initial investment by mapping out leasehold improvements, equipment like wine storage racks, and pre-opening costs. The break-even analysis identifies the exact sales volume needed to cover your $8,000 monthly rent and $11,000+ in fixed monthly overhead. Knowing how to calculate franchise startup costs accurately prevents mid-ramp liquidity crunches.

The model incorporates built-in benchmarks to help you sanity-check your wine bar franchise business plan against industry standards. Compare your 13.5% wine COGS (cost of goods sold) and staffing costs for expert roles like a $80,000 Head Sommelier against typical luxury retail ranges. This ensures your franchise profitability model stays grounded in competitive reality.


Simply purchase and download the financial model template, then access it instantly using Microsoft Excel or Google Sheets. No installation or technical expertise required-just open and start working.

Enter your business-specific numbers, including revenue projections, costs, and investment details. The pre-built formulas will automatically calculate financial insights, saving you time and effort.

Leverage the investor-ready format to confidently showcase your financial projections to banks, franchise representatives, or investors. Impress stakeholders with clear, data-driven insights and professional reports.

Leverage the investor-ready format to confidently present your projections to banks, franchise representatives, or investors.