
All-in-one Dashboard
Core inputs and core outputs


This comprehensive franchise unit financial model template provides a data-driven roadmap for managing capital expenditure planning and daily operational cash flow.
Core inputs and core outputs
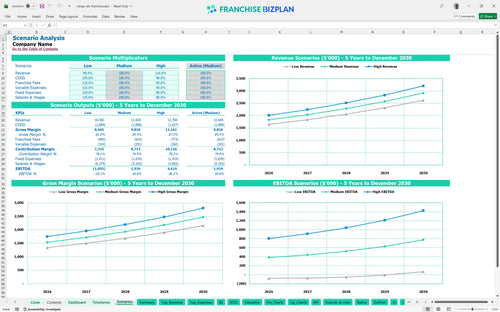
Three scenario analysis
Presentation ready
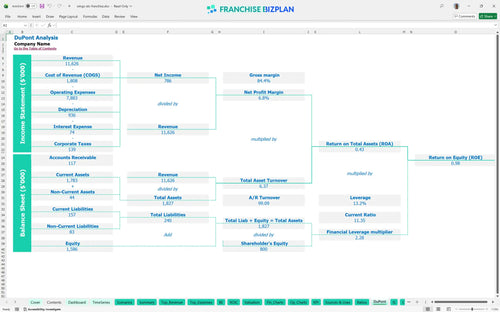
DuPont analysis
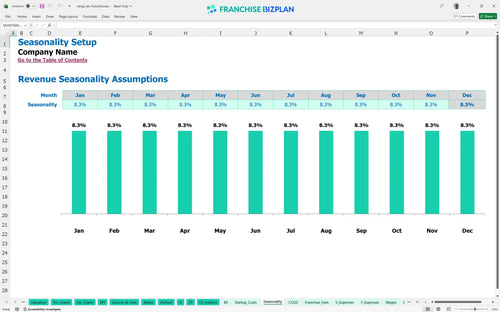
Researched revenue assumptions
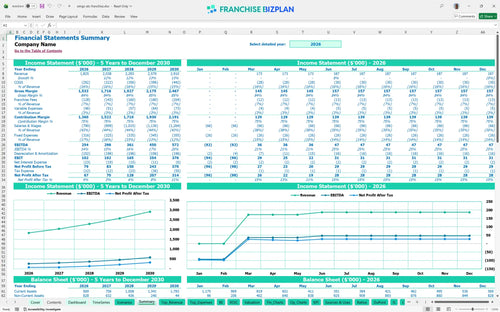
Lender-friendly financial outputs
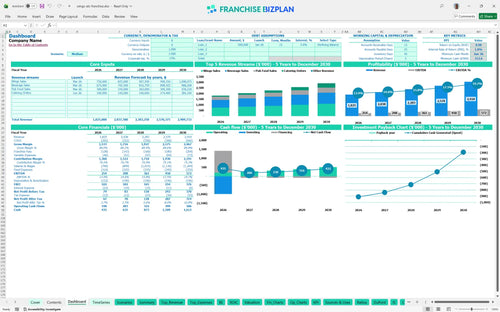
Revenue stream detailed view
Performance metrics benchmark
We developed this Wings Etc. Franchise franchise unit financial model through deep research into the sports bar and pub sector. The model comes pre-loaded with specific data, such as a $1.82 million year-one revenue target and detailed staffing plans for a General Manager and Kitchen Manager, all of which you can edit to fit your local market. It defintely helps you move from guessing to planning with real-world numbers like the $18,000 monthly rent and 5% royalty fees.
This franchise unit is projected to reach its break-even point in April 2026, just four months after launch. By year one, you should see an EBITDA of $254,000, which grows to $572,000 by year five as catering and beverage sales scale. Profitability depends on maintaining that 14% food cost while managing the ramp-up of your server and bartender staff.
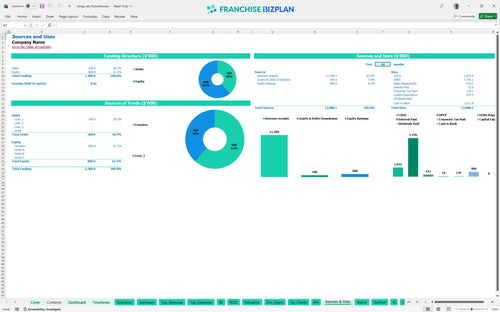
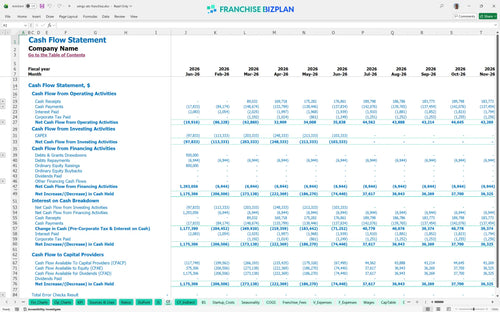
You will need approximately $979,500 in total capital to launch this unit, which includes the $39,500 franchise fee and significant leasehold improvements. This investment covers the high-end audiovisual systems and kitchen equipment necessary to meet brand standards. The model also accounts for a minimum cash buffer of $213,000 to handle the initial operating months.
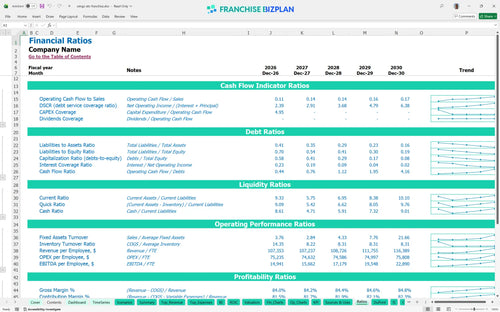
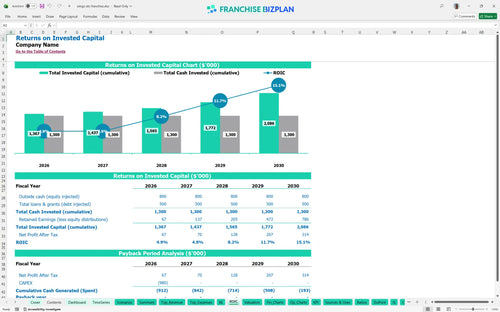
Based on the current projections, the internal rate of return (IRR) is 1.83% with a return on equity (ROE) of 0.98. While the cash flow is strong, the high initial CAPEX means the full payback period extends beyond the first five years of operation. This is a long-term play focused on building a stable, high-volume community staple rather than a quick flip.
The unit needs to clear its fixed cost hurdle, primarily driven by the $18,000 monthly rent and $85,000 GM salary, within the first few months. Reaching break-even by month four is achievable if you hit the $1.82 million year-one revenue target. The biggest lever here is volume; you need consistent foot traffic to offset the $25,500 in basic monthly fixed operating costs.
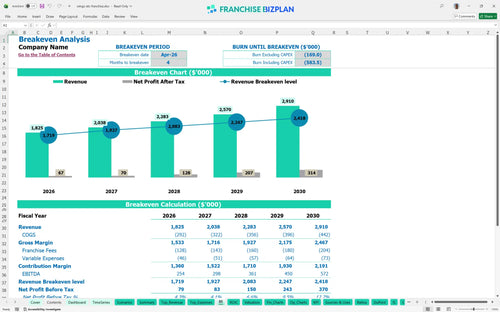
Your lowest cash point is projected to be $213,000 in June 2026, roughly six months after you start the build-out. This indicates you need a solid working capital reserve to bridge the gap between initial construction and full-capacity trading. If your leasehold improvements go over budget or the restuarant opening is delayed, this cash buffer becomes your lifeline.
In a high-growth scenario, pushing revenue toward the year-five target of $2.91 million early would significantly improve your IRR and shorten the payback period. Conversely, a low-revenue scenario where catering fails to launch would put pressure on your $213,000 cash floor. The model shows that a 10% shift in beverage sales has a outsized impact on the bottom line due to higher margins.
Finance: update unit break-even and payback model by Friday.
This franchise financial model is a fully customizable Excel tool designed for precision in the sports bar and pub sector. It features pre-filled formulas and editable assumptions that allow you to adapt the numbers to your specific territory, local labor rates, and real estate costs without starting from scratch.

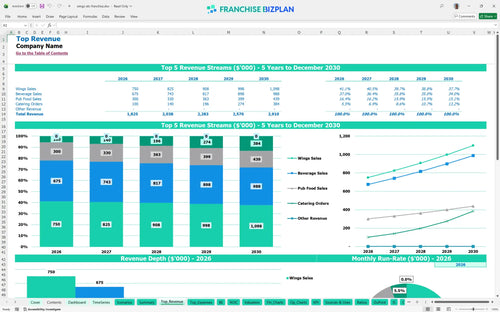
Planning for a multi-unit future requires a detailed 5-year outlook on revenue and cash flow. This model forecasts growth from $1.82 million in year one to over $2.91 million by year five, giving you a clear view of how unit economics evolve as the location matures and catering operations scale up. Accurate revenue forecasting is the backbone of this long-term profitability analysis.

The model simplifies complex financial obligations by hard-coding the royalty fee structure and brand requirements. It accounts for a 5% royalty and a 2% marketing fund contribution based on gross sales, ensuring you see the exact impact of these fees on your store-level margin. Understanding franchise royalty and marketing fees is vital before signing your FDD.

Estimating restaurant startup costs is often where new owners miss the mark, but this tool tracks every dollar from the $39,500 franchise fee to the $350,000 leasehold improvements. It provides a clear break-even analysis, showing exactly what sales volume you need to cover fixed costs like your $18,000 monthly rent and variable kitchen expenses.

We built this model using industry-standard unit economics to help you sanity-check your projections. With food ingredients set at 14% and packaging at 2%, you can compare your performance against typical pub and grill margins. These benchmarks help you identify if your labor or COGS (cost of goods sold) are drifting away from the brand standard.


Simply purchase and download the financial model template, then access it instantly using Microsoft Excel or Google Sheets. No installation or technical expertise required-just open and start working.

Enter your business-specific numbers, including revenue projections, costs, and investment details. The pre-built formulas will automatically calculate financial insights, saving you time and effort.

Leverage the investor-ready format to confidently showcase your financial projections to banks, franchise representatives, or investors. Impress stakeholders with clear, data-driven insights and professional reports.

Leverage the investor-ready format to confidently present your projections to banks, franchise representatives, or investors.