
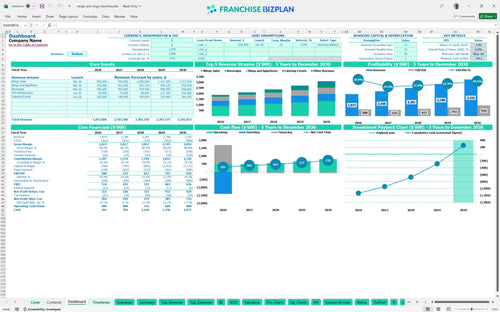
All-in-one Dashboard
Core inputs and core outputs


The franchise unit financial model template provides a comprehensive Excel-based tool for calculating startup costs, five-year profitability, and investment returns for a new sports dining location.
Core inputs and core outputs
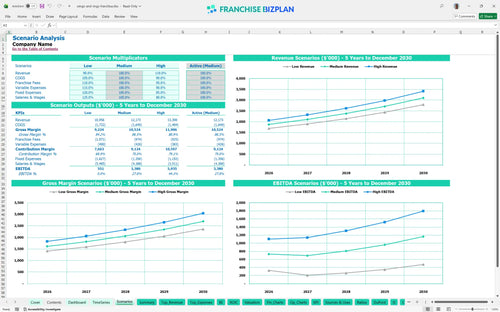
Three scenario analysis
Presentation ready
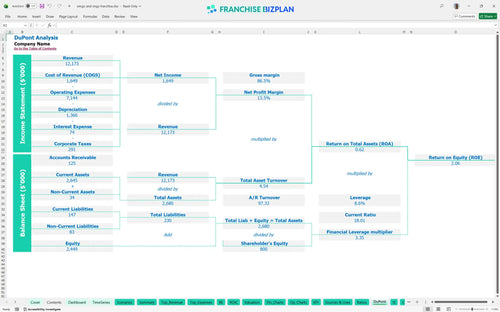
DuPont analysis
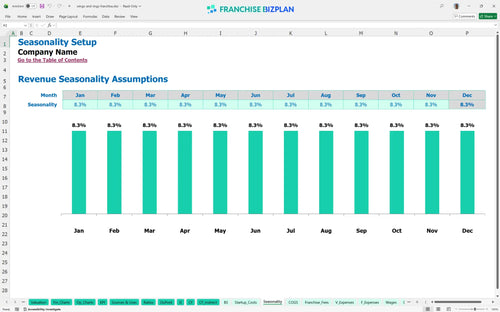
Researched revenue assumptions
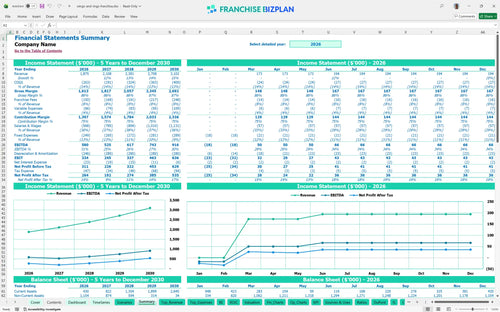
Lender-friendly financial outputs
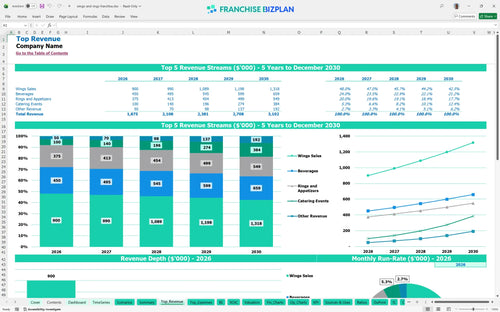
Revenue stream detailed view
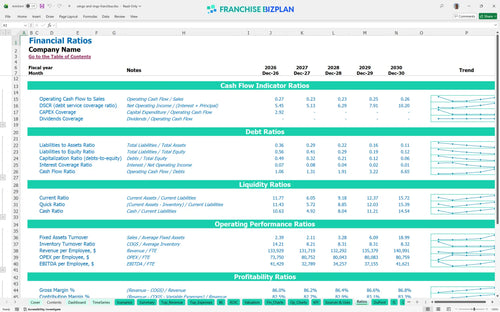
Performance metrics benchmark
We built this franchise unit financial model using our own research to provide a realistic view of the business. Key assumptions including revenue streams, operating expenses, and marketing fund contributions are pre-populated with researched data specific to this sports dining franchise unit and are fully editable. With a year-one EBITDA of $580,000 and revenue of $1,875,000, the model demonstrates the potential of the unit economics.
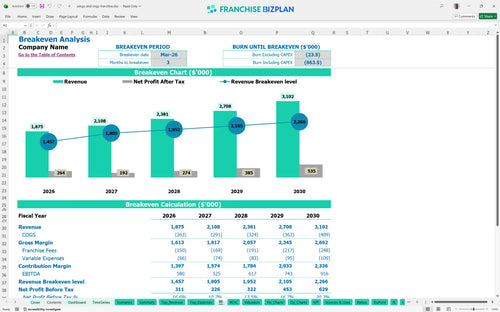
This franchise unit becomes profitable quickly, reaching its monthly break-even point in March 2026, just three months after launch. By year five, the model projects an annual EBITDA of $916,000 as catering and VIP memberships scale.
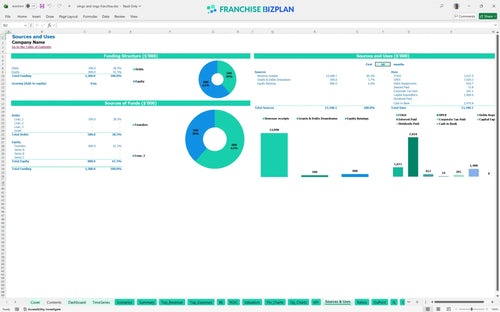
You will need $1,400,000 to launch this franchise unit in the US. This total initial investment includes a $40,000 franchise fee, $600,000 for leasehold improvements, and $400,000 for kitchen and bar equipment.
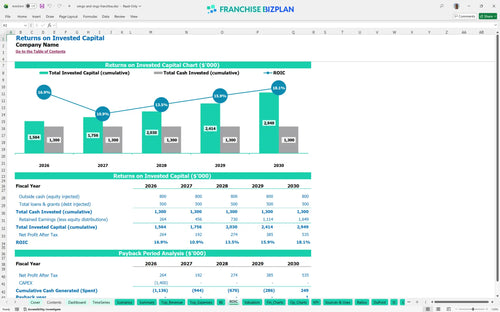
A franchisee can expect an Internal Rate of Return (IRR) of 2.77% and a Return on Equity (ROE) of 2.06%. Given the $1.4 million startup cost, the payback period is estimated at 5 years.
The monthly break-even point is reached in March 2026. The most critical driver for this is maintaining high volume in wings and beverages to cover the $15,000 monthly rent and 8% total franchise fee burden.
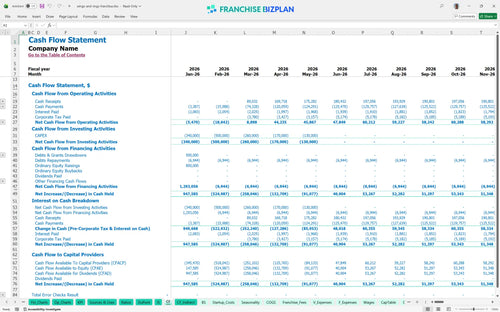
The lowest cash point occurs in May 2026 at negative $59,000, meaning you will defintely need a working capital buffer. Careful management of the $100,000 AV system and $80,000 signage payments is vital during the ramp-up.
Comparing scenarios shows that a 10% revenue increase in the High case significantly improves the year-one $580,000 EBITDA. The model helps you see how local marketing and server productivity drive the sports bar franchise profit and loss statement.
This franchise financial model is a flexible Excel framework that allows you to adjust every revenue and cost assumption to fit your specific location. You can easily modify the pre-filled formulas to test different sports bar franchise investment analysis scenarios, ensuring the projections align with your local market conditions and operating goals.

Long-term planning is essential for a restaurant franchise business plan, and this model provides a detailed five-year outlook. It tracks your growth from an initial $1.87 million in year-one sales to over $3.1 million by year five, giving you a clear view of how scaling affects your store-level EBITDA and long-term cash flow.

This tool simplifies the management of franchise-specific costs by automatically calculating the 5% royalty and 3% marketing fund contributions. By integrating these ongoing obligations into your franchise profit and loss spreadsheet, you can accurately forecast the actual net income available after meeting all brand standards and fee requirements.

Our franchise startup cost template helps you map out the $1.4 million initial investment required to open your doors. It includes a detailed break-even analysis that identifies the exact month-projected as March 2026-when your sports dining franchise starts covering its fixed costs and generating a surplus.

The model incorporates industry-standard benchmarks for labor and food costs to help you sanity-check your unit economics. For instance, comparing your 12.5% food ingredient cost against typical sports bar ranges ensures your franchise unit financial forecasting for investors is grounded in reality rather than best-case assumptions.


Simply purchase and download the financial model template, then access it instantly using Microsoft Excel or Google Sheets. No installation or technical expertise required-just open and start working.

Enter your business-specific numbers, including revenue projections, costs, and investment details. The pre-built formulas will automatically calculate financial insights, saving you time and effort.

Leverage the investor-ready format to confidently showcase your financial projections to banks, franchise representatives, or investors. Impress stakeholders with clear, data-driven insights and professional reports.

Leverage the investor-ready format to confidently present your projections to banks, franchise representatives, or investors.