
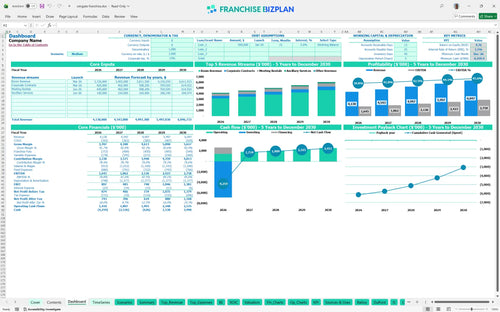
All-in-one Dashboard
Core inputs and core outputs


This financial model template for midscale hotel franchise provides a complete toolkit for analyzing unit-level performance, from initial build-out through five years of operational cash flow.
Core inputs and core outputs
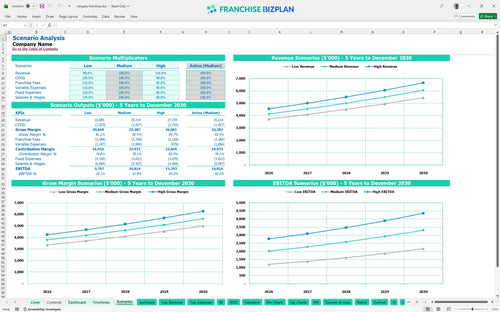
Three scenario analysis
Presentation ready
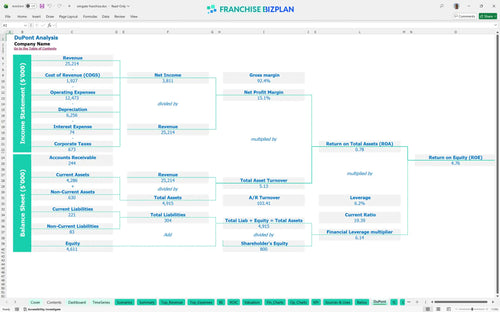
DuPont analysis
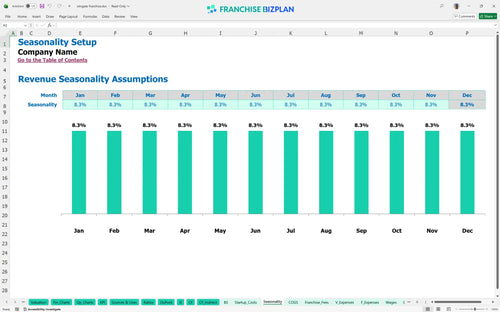
Researched revenue assumptions
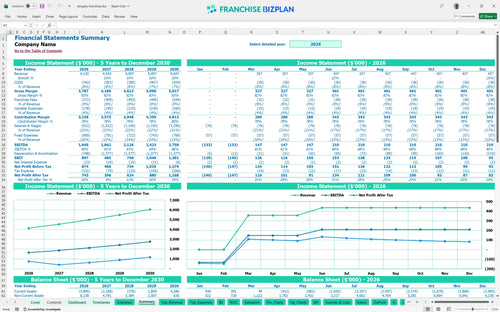
Lender-friendly financial outputs
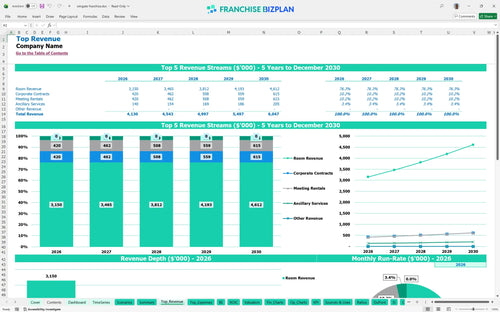
Revenue stream detailed view
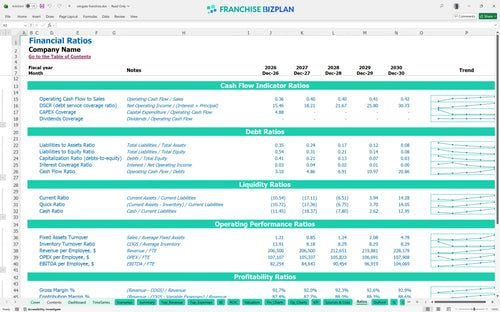
Performance metrics benchmark
We built this franchise unit business plan template using deep research into midscale hospitality performance. The model includes pre-populated data for a hotel franchise unit, showing year one revenue of $4.13 million and EBITDA of $1.64 million, while remaining fully editable for your specific location. You can adjust every lever from the $3.5 million leasehold budget to the 6% royalty fee to see how local market shifts impact your final ROI.
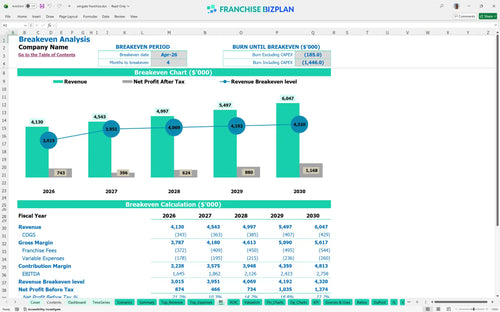
The unit reaches its break-even point in April 2026, just four months after the primary launch. Analyzing profit margins for midscale hotel properties shows that while year one EBITDA is strong at $1.64 million, true net profitability depends on maintaining room revenue above the $2.1 million baseline.
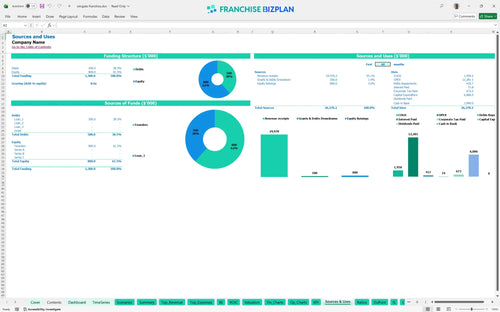
This hotel startup cost calculator estimates a heavy initial lift, including $3.5 million for leasehold improvements and $1 million for building upgrades. Total pre-opening costs and CAPEX exceed $6.8 million, including the $36,000 franchise fee and $800,000 for furniture and fixtures.
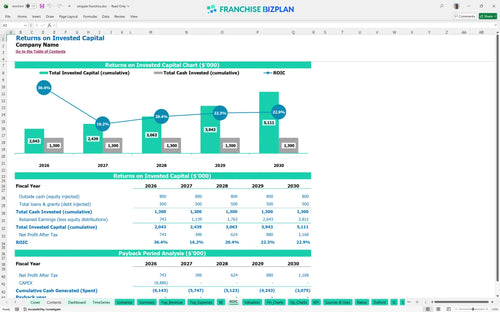
The ROI projection for business-focused hotel franchise shows an IRR of 1.46% and an ROE of 4.76%. While the unit generates significant cash flow, the high initial investment means the full payback period extends beyond the initial five-year forecast window.
The monthly break-even occurs in April 2026, driven primarily by the $2.1 million annual room revenue target. Best practices for hotel franchise revenue forecasting suggest that room nights are the biggest lever, as fixed costs like the $30,000 monthly rent remain constant regardless of occupancy.
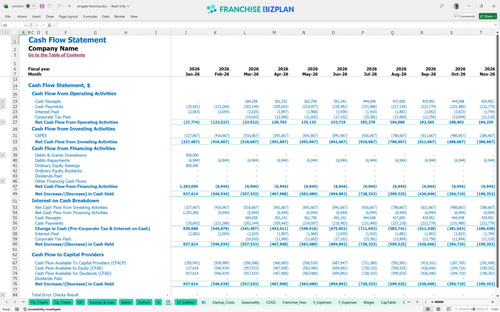
Creating a financial budget for a new hotel franchise unit reveals a minimum cash point of -$4.25 million in December 2026. This indicates a significant need for external financing or a large capital reserve to handle the timing gap between construction spend and operational ramp-up.
This financial planning guide for new hotel franchise owners compares how a 10% shift in revenue impacts the $1.64 million year one EBITDA. Moving to a high-growth scenario by securing more corporate contracts can significantly improve the 1.46% IRR and shorten the long-term payback timeline.
Finance: update unit break-even and payback model by Friday
This hotel franchise financial model is defintely built for flexibility in Excel, allowing you to swap out every assumption from room rates to local labor costs. You can adjust the pre-filled formulas to match your specific territory or real estate conditions, ensuring the commercial real estate pro forma reflects your actual site potential rather than just a brand average.

A successful hotel investment financial projection requires a long-term view of how occupancy and ADR (average daily rate) grow over time. This model provides a detailed 5-year outlook, mapping out how your EBITDA scales from $1.64 million in year one to over $2.75 million by year five as your property matures in the local market.

Managing franchise royalty fees is critical for maintaining store-level margins in the hospitality sector. This tool automatically calculates the 6% royalty and 3% marketing fee against your room revenue, ensuring you see the exact impact of brand obligations on your bottom line before you sign a long-term agreement.

Learning how to calculate startup costs for a hotel franchise is the first step in de-risking your investment. The model aggregates everything from the $36,000 initial fee to the $3.5 million leasehold improvements, providing a clear path to the April 2026 break-even point where your monthly revenue finally covers your fixed hotel operational expenses.

Use this model to sanity-check your hospitality industry KPI targets against researched midscale standards. By comparing your projected labor costs and breakfast COGS (cost of goods sold) to these benchmarks, you can identify margin leaks early and adjust your occupancy rate forecasting to stay competitive in high-demand corridors.


Simply purchase and download the financial model template, then access it instantly using Microsoft Excel or Google Sheets. No installation or technical expertise required-just open and start working.

Enter your business-specific numbers, including revenue projections, costs, and investment details. The pre-built formulas will automatically calculate financial insights, saving you time and effort.

Leverage the investor-ready format to confidently showcase your financial projections to banks, franchise representatives, or investors. Impress stakeholders with clear, data-driven insights and professional reports.

Leverage the investor-ready format to confidently present your projections to banks, franchise representatives, or investors.