
All-in-one Dashboard
Core inputs and core outputs


This franchise unit profitability spreadsheet and financial model template for quick service restaurant provides a complete roadmap for analyzing cash flow, ROI, and operational efficiency.
Core inputs and core outputs
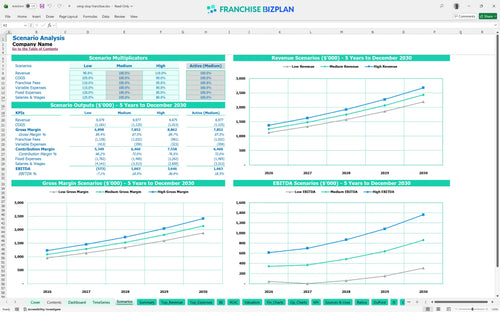
Three scenario analysis
Presentation ready
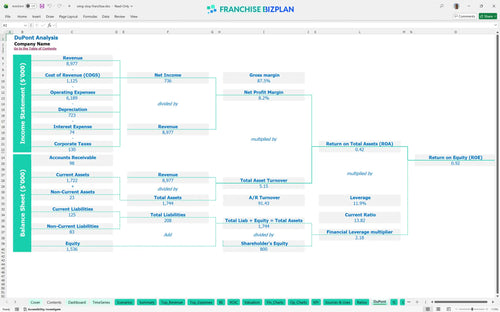
DuPont analysis
Researched revenue assumptions
Lender-friendly financial outputs
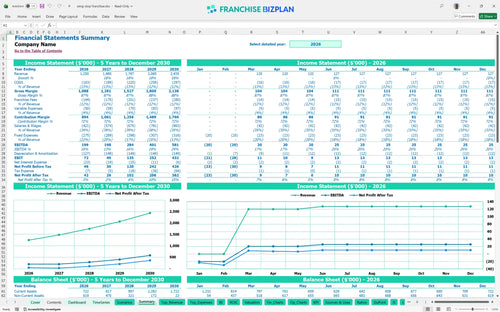
Revenue stream detailed view
Performance metrics benchmark
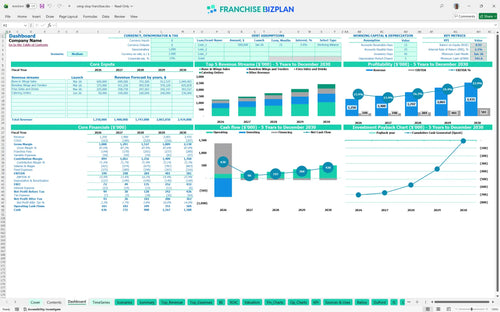
We developed this franchise unit financial model using our own research into high-volume wing concepts. Key assumptions like the 6% royalty and 5.5% marketing fund are pre-populated with data specific to this franchise and are fully editable. The model shows a year-one EBITDA of $199,000 that you can defintely adjust as you scout locations and refine your restaurant profit margins.
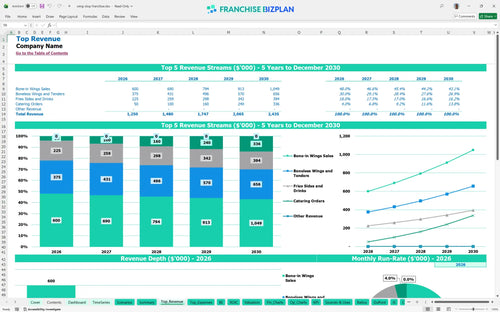
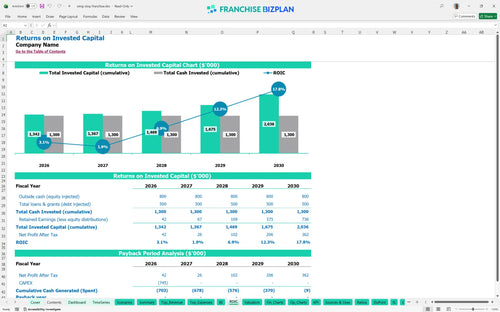
The restaurant franchise revenue forecasting model shows the unit hits breakeven in April 2026, just four months after launch. While year-one EBITDA is healthy at $199,000, true net profit scales as catering revenue grows from $50,000 to over $336,000 by year five.
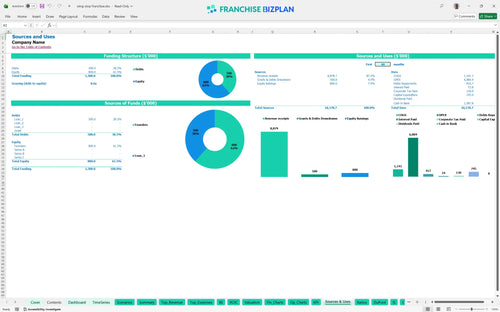
You need a substantial investment to open a prime campus-adjacent location, with total CAPEX and OPEX planning reaching roughly $745,000. This includes the $25,000 initial fee, $200,000 in kitchen equipment, and a $350,000 build-out to handle high-volume digital orders.
This ROI analysis shows an IRR of 2.08% with a payback period extending beyond five years. While year-five EBITDA reaches $581,000, this franchise financial projection spreadsheet for investors shows that high startup costs mean you are playing a long-term equity game.
You hit the monthly break-even point in month 4 of operations. The biggest drag on your margin is the $18,000 monthly rent, and best practices for managing franchise unit operating expenses suggest you need high throughput to cover this fixed overhead.
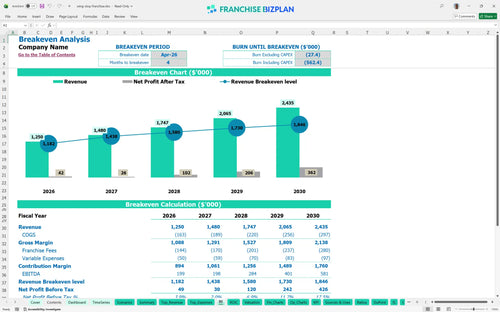
Your lowest cash point is $541,000 in June 2026, which includes your initial capital buffer. Estimating profitability for a campus-based franchise requires keeping several months of operating expenses ready to handle seasonal student breaks and summer slowdowns.
A high-revenue scenario driven by game-day catering can push year-one EBITDA well above $199,000. This financial feasibility study for new restaurant location shows that if labor costs for late-night shifts spike, your peak cash need will increase significantly.
Finance: update unit break-even and payback model by Friday.
This restaurant franchise financial model is built in Excel with open formulas and flexible assumptions. You can adjust everything from wing flavor mix to local labor rates to see how they impact your bottom line and unit economics.

Map out your growth from a $1.25M opening year to a projected $2.43M by year five using this franchise investment analysis tool. This model tracks how analyzing catering revenue potential for restaurant franchises and scaling digital sales improves your long-term unit economics.

Don't let the 6% royalty and 5.5% marketing fee surprise you. This spreadsheet template for franchise royalty and marketing fee tracking calculates these franchise royalty fees off the top so you know exactly what remains for store-level EBITDA.

With a $350,000 build-out and $200,000 in kitchen equipment, your entry cost is significant. Use this restaurant startup cost template to learn how to calculate startup costs for a restaurant franchise and find the exact monthly volume needed to cover your $18,000 prime location rent.

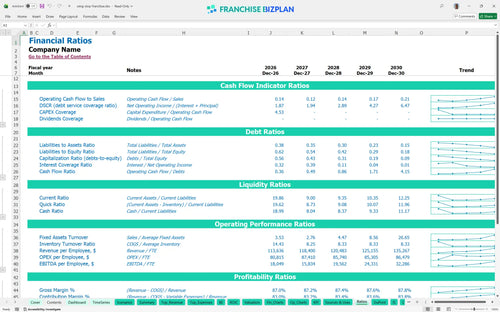
Compare your 11% food cost and staffing levels against fast food franchise business plan standards. This tool assists in calculating labor costs for high-volume restaurant operations to ensure your spend is aligned with your $1.2M+ volume.


Simply purchase and download the financial model template, then access it instantly using Microsoft Excel or Google Sheets. No installation or technical expertise required-just open and start working.

Enter your business-specific numbers, including revenue projections, costs, and investment details. The pre-built formulas will automatically calculate financial insights, saving you time and effort.

Leverage the investor-ready format to confidently showcase your financial projections to banks, franchise representatives, or investors. Impress stakeholders with clear, data-driven insights and professional reports.

Leverage the investor-ready format to confidently present your projections to banks, franchise representatives, or investors.