
All-in-one Dashboard
Core inputs and core outputs


This franchise unit financial model template provides a data-driven framework to project revenue, manage expenses, and evaluate the total return on your investment.
Core inputs and core outputs
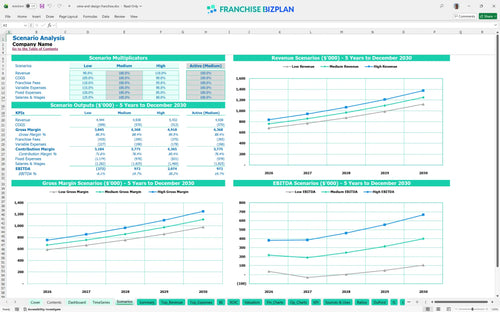
Three scenario analysis
Presentation ready
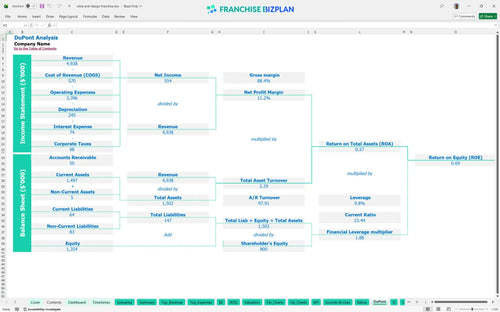
DuPont analysis
Researched revenue assumptions
Lender-friendly financial outputs
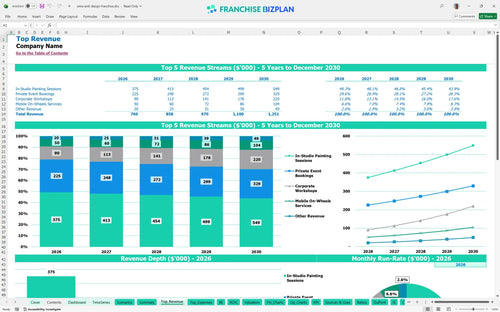
Revenue stream detailed view
Performance metrics benchmark
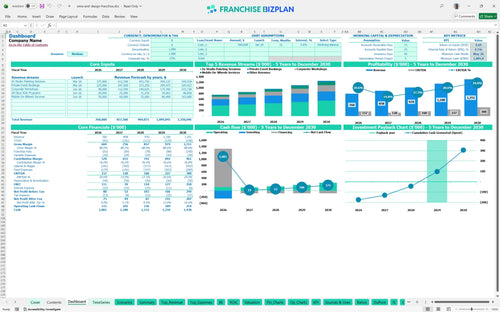
We built this franchise unit financial model using detailed research into the creative nightlife and DIY entertainment sector. Key assumptions, including the $760,000 year-one revenue target and the 6% royalty structure, are pre-populated and fully editable to reflect your specific territory. This tool allows you to visualize how in-studio sessions and mobile services contribute to the $157,000 first-year EBITDA.
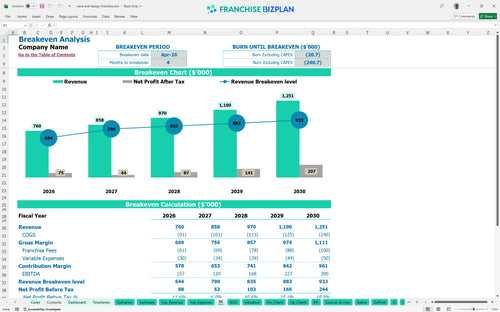
This franchise unit reaches profitability in April 2026, just four months after launching. While Year 1 EBITDA is $157,000, it dips to $120,000 in Year 2 as the mobile unit and full staffing ramp up, eventually climbing to $300,000 by Year 5.
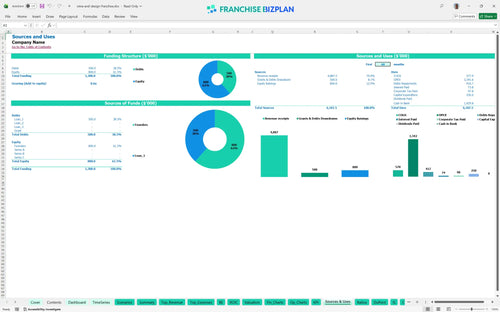
You need significant capital to cover the $100,000 studio build-out and the $25,000 initial franchise fee. Total startup costs also include $45,000 for a mobile van conversion and $30,000 for art stations, requiring a total cash position that accounts for early operating losses.
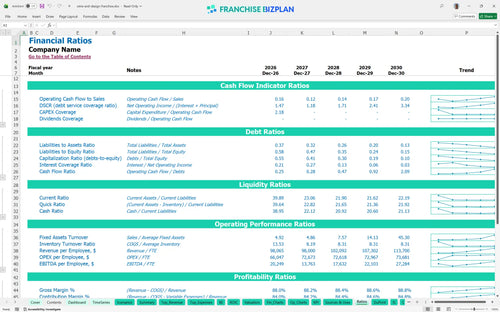
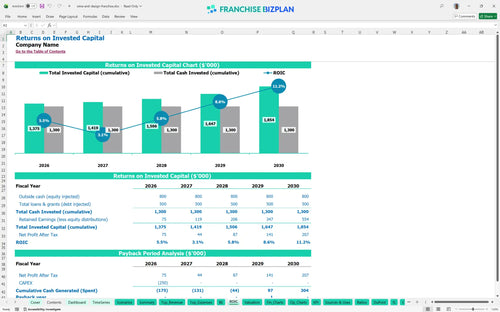
The model projects a 4.09% Internal Rate of Return (IRR) and a 4-year payback period for the initial investment. With a Return on Equity (ROE) of 0.69, the investment relies on scaling annual revenue from $760,000 to over $1.25 million to drive long-term value.
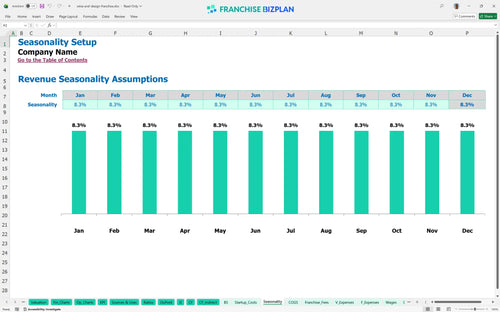
The monthly break-even is achieved by April 2026, driven primarily by the need to cover $10,000 in monthly rent and $2,200 in utilities. Volume in the in-studio painting sessions is the most critical lever, as it represents the largest portion of the $760,000 year-one revenue.
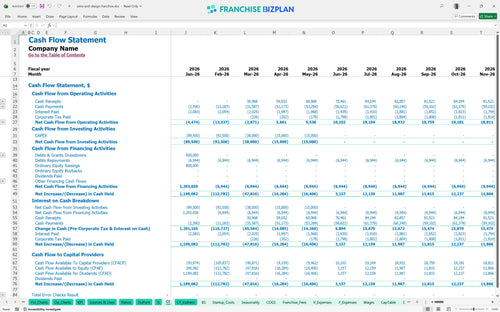
The lowest cash point occurs in May 2026 with a balance of $1,006,000, indicating a need for strong liquidity during the initial ramp-up. You should maintain a cash buffer to handle the timing gap between the $100,000 build-out costs and the maturation of the private event revenue stream.
A High scenario improves the 4-year payback period by increasing the $760,000 Year 1 revenue through better local marketing. Conversely, a Low scenario may delay the April 2026 break-even if the $10,000 monthly rent isn't supported by consistent session volume and ticket sales.
This franchise unit financial model is a flexible Excel tool designed to handle the specific moving parts of a creative entertainment business. You can adjust the pre-filled formulas and assumptions to match your specific market, whether you are looking at a high-traffic urban spot or a suburban territory. It defintely helps you stress-test different scenarios before signing a lease.

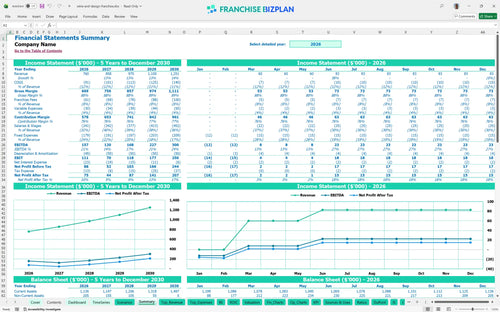
Long-term planning is vital when scaling from $760,000 in year one to over $1.25 million by year five. This model provides a detailed look at how revenue, costs, and cash flow evolve as the studio matures and adds services like mobile units and kids' programs. It gives you a clear view of the bottom line across the full initial franchise term.

The model tracks the specific financial obligations that come with a brand, starting with the $25,000 initial fee. It automatically calculates the 6% royalty and 2% marketing fund contributions against your monthly sales projections. This ensures you see the true store-level margin after the franchisor takes their cut, which is critical for maintaining healthy unit economics.

Launching a studio requires upfront capital for items like the $100,000 build-out and $30,000 in art stations. This model helps you map out the total investment and identifies the exact sales volume needed to cover your $10,000 monthly rent and other fixed costs. Knowing your break-even point helps you manage the early months when traffic is still ramping up.

We have integrated industry-standard benchmarks for labor and occupancy to help you verify your projections. For instance, if your art supplies exceed the 8.5% target or labor costs drift too high, the model flags the variance. This allows you to compare your expected performance against typical ranges for the paint-and-sip and DIY craft sectors.


Simply purchase and download the financial model template, then access it instantly using Microsoft Excel or Google Sheets. No installation or technical expertise required-just open and start working.

Enter your business-specific numbers, including revenue projections, costs, and investment details. The pre-built formulas will automatically calculate financial insights, saving you time and effort.

Leverage the investor-ready format to confidently showcase your financial projections to banks, franchise representatives, or investors. Impress stakeholders with clear, data-driven insights and professional reports.

Leverage the investor-ready format to confidently present your projections to banks, franchise representatives, or investors.