
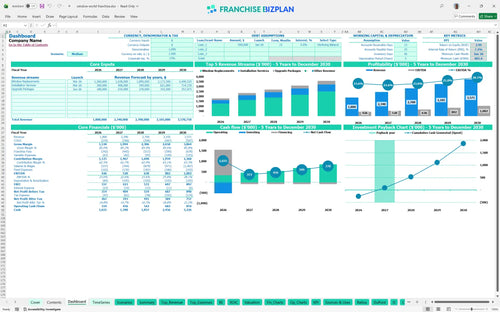
All-in-one Dashboard
Core inputs and core outputs


This franchise unit financial model template provides a complete Excel-based toolkit for ROI forecasting and small business financial forecasting for a residential window installation business.
Core inputs and core outputs
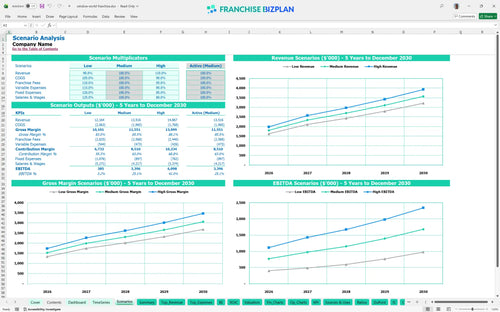
Three scenario analysis
Presentation ready

DuPont analysis
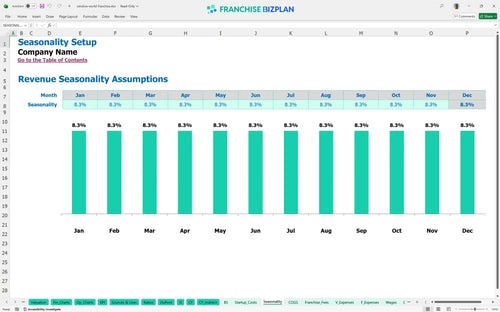
Researched revenue assumptions

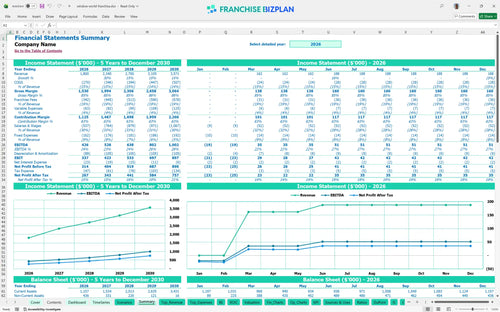
Lender-friendly financial outputs

Revenue stream detailed view
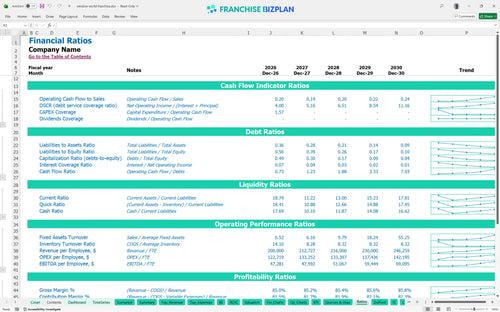
Performance metrics benchmark
We built this financial model template for home services franchise unit owners using detailed research on the window replacement sector. The pre-populated data includes a $1.8 million year-one revenue target and a $45,000 initial fee, but you can defintely edit every cell to match your local market. This model helps you track everything from the $150,000 mobile sales fleet investment to the 12% royalty burden.
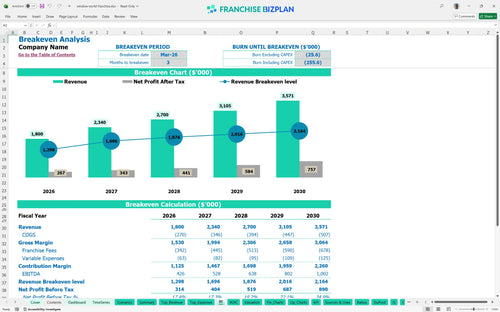
The unit is projected to reach profitability very quickly, with a break-even date in March 2026, just three months after launch. By the end of the first year, the model forecasts an EBITDA of $426,000, which scales to over $1 million by year five as you add more sales representatives and installers. Speed to profit is the primary goal here.
You will need approximately $525,000 in initial capital to cover the window installation franchise startup costs and equipment. This includes the $45,000 franchise fee, $150,000 for showroom improvements, and $150,000 for your mobile sales fleet. Capital is fuel; don't run out before the engine starts.
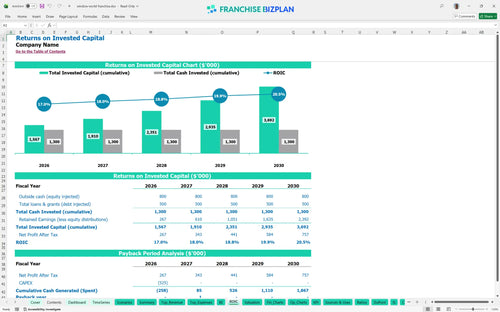
Analyzing return on investment for home improvement franchise units shows an Internal Rate of Return (IRR) of 7.23% and a Return on Equity (ROE) of 2.99. The model estimates a payback period of 2 years, meaning you recover your initial investment through cash flow by the start of year three. A two-year payback is a strong signal for multi-unit growth.
The monthly break-even point occurs in March 2026, driven primarily by the volume of window replacement jobs and the 12% royalty fee. To hit this early, you must focus on lead generation for the 1990s-era developments where cooling costs are high. Volume is your best friend for covering fixed costs.
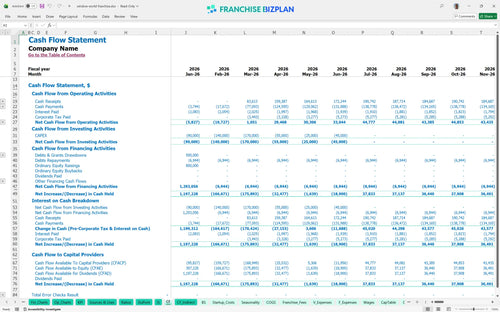
The lowest cash point is projected at $802,000 in June 2026, which accounts for the initial ramp-up and the timing of your visualization technology and signage investments. You should maintain a cash buffer to handle the lag between window ordering and final installation payment. Cash is king, especially during the ramp-up phase.
In a high-growth scenario, increasing your sales rep count to 4.5 FTE (full-time equivalent) by year five can push revenue toward the $3.57 million mark. Conversely, a low scenario with slower lead conversion would delay your 2-year payback and tighten margins due to the $8,500 fixed rent. Planning for the worst helps you achieve the best.
This franchise unit financial model template is built in Excel to give you total control over your window replacement franchise business plan. You can adjust pre-filled formulas and editable assumptions for your specific territory, whether you are looking at labor costs in Austin or rent near the I-35 corridor. Flexibility is the core of this tool.

Mapping out a home improvement franchise investment analysis requires a long-term view of how sales ramp up over time. This model provides a detailed 5-year outlook, showing revenue growing from $1.8 million in year one to over $3.5 million by year five. Long-term visibility prevents expensive surprises.

Understanding franchise royalty and marketing fees in financials is vital for protecting your store-level margin. The model automatically calculates the 12% royalty and 7% marketing fund contributions based on your projected window installation and service revenue. Royalties are a top-line tax you must model precisely.

This tool simplifies how to calculate startup costs for a window replacement franchise by organizing your initial $525,000 outlay into clear categories. You can see exactly how many window replacements and installation jobs you need to book each month to cover your $8,500 showroom rent. Knowing your number makes the first year less scary.

We integrated industry-specific data to help you perform a realistic home improvement franchise investment analysis. The model includes benchmarks for window material costs, which start at 12%, and fleet maintenance for your mobile sales units. Benchmarks keep your assumptions grounded in reality.


Simply purchase and download the financial model template, then access it instantly using Microsoft Excel or Google Sheets. No installation or technical expertise required-just open and start working.

Enter your business-specific numbers, including revenue projections, costs, and investment details. The pre-built formulas will automatically calculate financial insights, saving you time and effort.

Leverage the investor-ready format to confidently showcase your financial projections to banks, franchise representatives, or investors. Impress stakeholders with clear, data-driven insights and professional reports.

Leverage the investor-ready format to confidently present your projections to banks, franchise representatives, or investors.