
All-in-one Dashboard
Core inputs and core outputs


This Excel template for franchise financial forecasting provides a complete roadmap for tracking revenue streams, managing payroll for five different staff roles, and monitoring cash flow from launch through year five.
Core inputs and core outputs
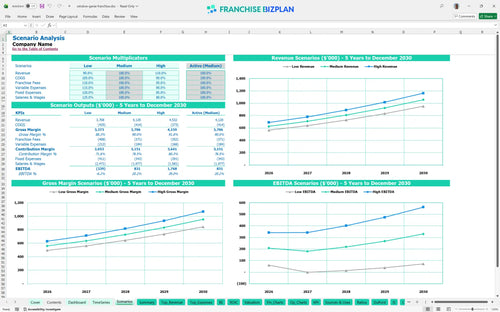
Three scenario analysis
Presentation ready
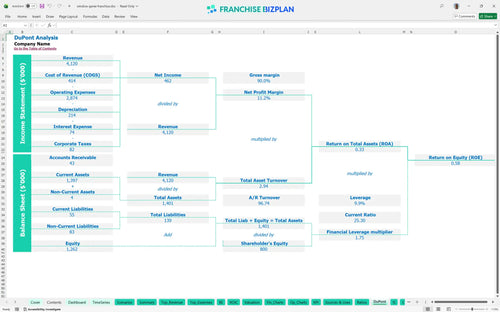
DuPont analysis
Researched revenue assumptions
Lender-friendly financial outputs
Revenue stream detailed view
Performance metrics benchmark
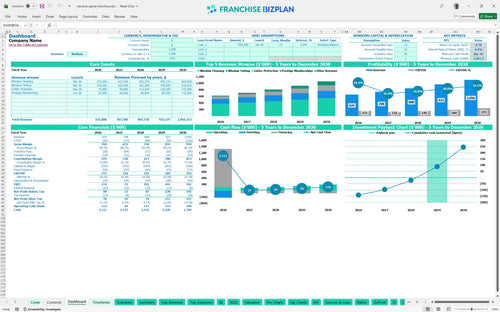
We built this franchise unit financial model using our own research to provide a realistic roadmap for your new territory. Key assumptions including the $625,000 year-one revenue target and the 7% royalty structure are pre-populated with researched data and remain fully editable. With a projected 4.38% IRR and a 3-month window to reach break-even, this tool helps you track the path to a $235,000 annual EBITDA by year five.
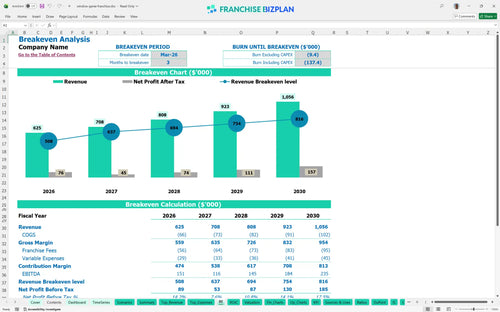
This franchise unit hits its stride early, reaching a monthly break-even point by March 2026, just three months after launch. While year-one EBITDA starts at $151,000, the model shows steady growth reaching $235,000 by year five as recurring prestige memberships scale. Profitability depends on maintaining your 4% material cost for films and gutters while managing the ramp-up of your technician team.
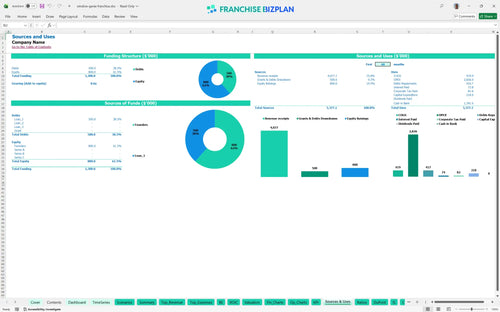
You will need a significant capital injection to get this unit off the ground, with a minimum cash requirement of $1,061,000 to navigate the ramp-up phase. This startup capital requirements for service-based franchises cover everything from the $40,000 franchise fee to $60,000 for a fleet of service vehicles. The model ensures you have enough liquidity to cover the $2,800 monthly rent and payroll during the initial months before the March 2026 break-even date.
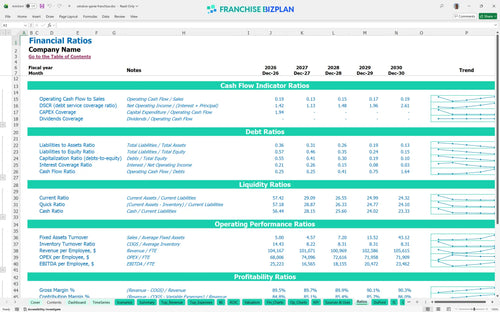
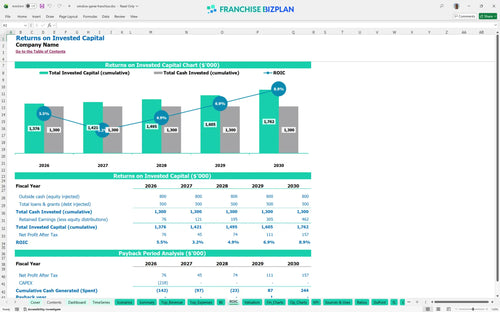
The model projects an IRR of 4.38% and a Return on Equity (ROE) of 0.58, reflecting a stable, long-term asset rather than a high-risk gamble. Your payback period is estimated at 4 years, which is typical for a home services franchise model with high upfront equipment and vehicle costs. By year five, the unit generates $235,000 in EBITDA, providing a solid yield on the initial investment as the business scales.
Monthly break-even occurs in March 2026, requiring the unit to generate enough volume to cover $5,000+ in fixed monthly costs including rent, insurance, and software. The biggest driver for reaching this point is labor productivity; with a $72,000 operations manager and a $55,000 lead technician on day one, you need your crews in the field billing hours immediately. Estimating profitability for residential service businesses requires a tight focus on these fixed payroll burdens during the first 90 days.
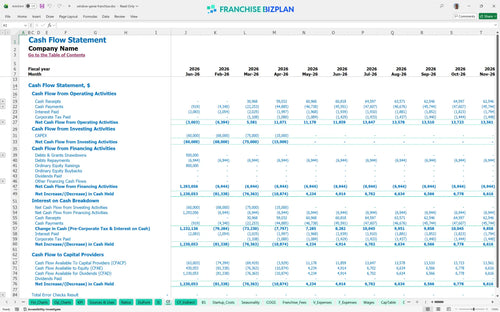
Your lowest cash point occurs in April 2026, just after the initial launch expenses and equipment purchases are finalized. You need to maintain a cash buffer to handle the $15,000 initial materials inventory and the $20,000 office setup costs. If the ramp-up of your window cleaning revenue, projected at $250,000 in year one, lags by even 20%, your cash runway will tighten significantly, making a contingency fund essential.
Analyzing franchise unit operating costs across low, medium, and high cases shows how sensitive the model is to volume. In a high-growth scenario where gutter protection sales exceed the $50,000 year-one estimate, your year-1 margin improves defintely because fixed costs like the $850 vehicle insurance are spread over more jobs. Conversely, a low-revenue scenario might push your payback period beyond 5 years, highlighting the need for aggressive local marketing execution from day one.
Finance: update unit break-even and payback model by Friday.
This franchise financial model lives in Excel, giving you total control over every variable from local labor rates to specific territory pricing. You can swap out pre-filled assumptions for your actual site data, making it easy to build a window cleaning franchise business plan that reflects your specific market density. Whether you are adjusting the mix of window tinting versus gutter work or tweaking the timing of your first van purchase, the formulas update instantly to show the impact on your bottom line.

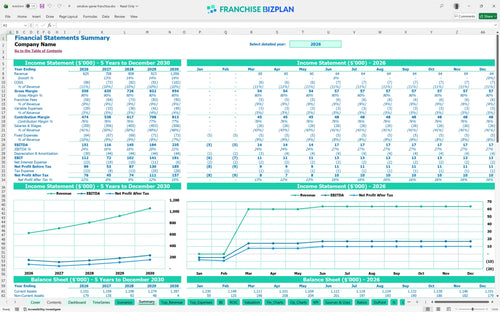
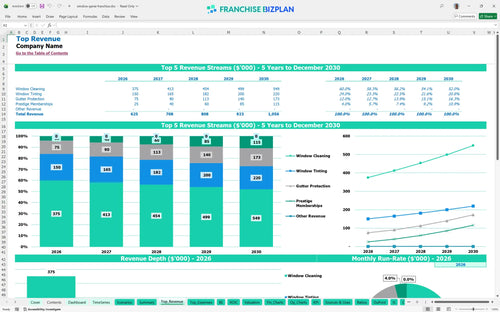
Success in home services requires looking past the first season to understand how recurring revenue scales over half a decade. This small business financial template provides a 5-year outlook, showing revenue climbing from $625,000 in year one to over $1,056,000 by year five. By mapping out five years of cash flow, you can see exactly when the business matures and how the 7% royalty fee impacts your ability to reinvest in new equipment or additional service vehicles.

Operating within a brand ecosystem means accounting for specific costs like the $40,000 initial franchise fee and ongoing 2% marketing fund contributions. This model tracks every dollar owed to the franchisor, ensuring your franchise profitability analysis accounts for these 'off-the-top' expenses before you pay for fuel or labor. It is vital to see how these fees interact with your gross margin, especially as you scale your service volume across multiple territories.

Knowing how to calculate startup costs for a home service franchise is the difference between a smooth launch and a mid-year cash crunch. This tool aggregates everything from the $60,000 service vehicle investment to the $15,000 for vehicle wraps and branding. By totaling these upfront needs, the model identifies your break-even sales level, showing you exactly how many window cleaning or tinting jobs you need to book each month to cover your $2,800 warehouse rent and $72,000 operations manager salary.

Don't guess on your numbers when you can use a franchise unit economic modeling spreadsheet built on researched data. The model includes benchmarks for labor costs, which are critical when you are managing a team of certified technicians and apprentices. If your cleaning supplies exceed the 6.5% benchmark in year one, you know you have a margin leak that needs fixing. These guardrails help you perform a realistic financial feasibility study for cleaning franchises before you sign a lease.


Simply purchase and download the financial model template, then access it instantly using Microsoft Excel or Google Sheets. No installation or technical expertise required-just open and start working.

Enter your business-specific numbers, including revenue projections, costs, and investment details. The pre-built formulas will automatically calculate financial insights, saving you time and effort.

Leverage the investor-ready format to confidently showcase your financial projections to banks, franchise representatives, or investors. Impress stakeholders with clear, data-driven insights and professional reports.

Leverage the investor-ready format to confidently present your projections to banks, franchise representatives, or investors.