
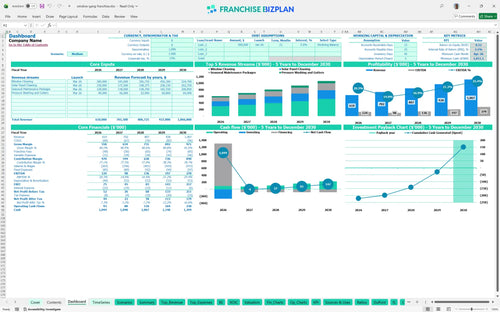
All-in-one Dashboard
Core inputs and core outputs


This comprehensive Excel tool provides a complete roadmap for launching and scaling a professional exterior maintenance unit with pre-built logic for all service lines.
Core inputs and core outputs
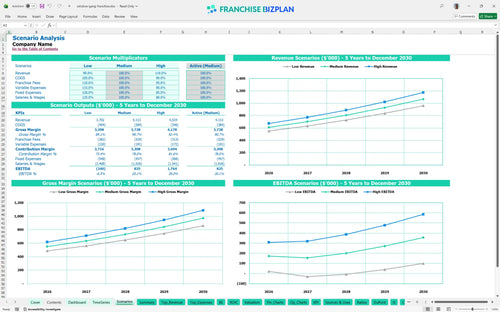
Three scenario analysis
Presentation ready
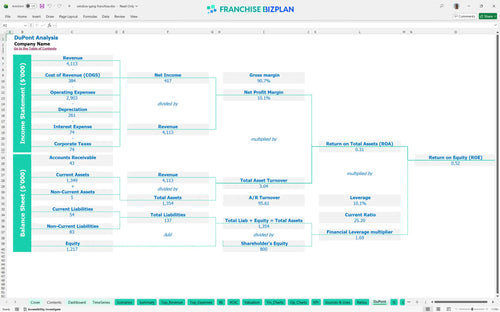
DuPont analysis
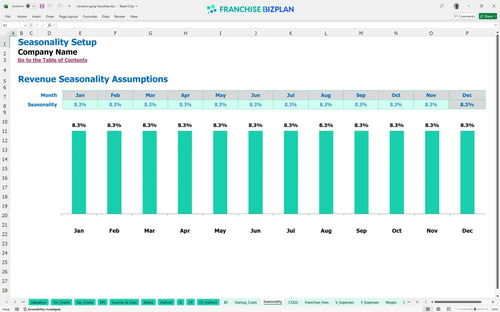
Researched revenue assumptions
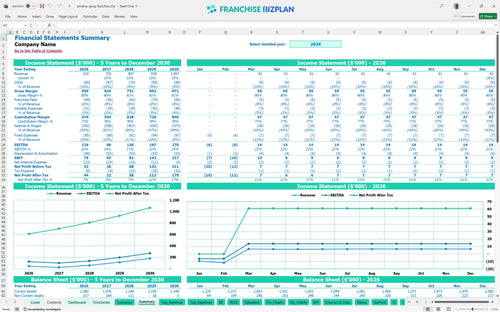
Lender-friendly financial outputs
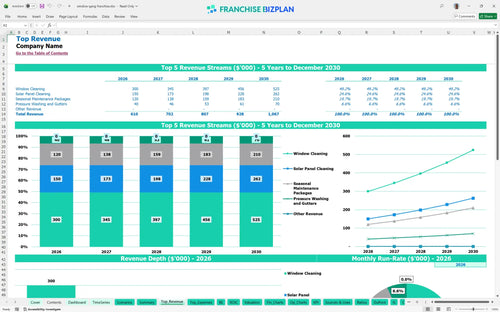
Revenue stream detailed view
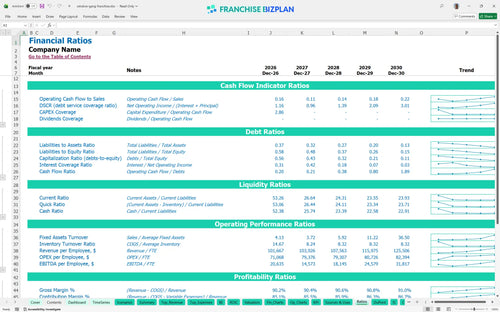
Performance metrics benchmark
We built this franchise unit financial model using our own research into the exterior maintenance sector. Key assumptions, including revenue streams for window and solar cleaning, operating expenses, and the $65,000 franchise fee, are pre-populated and fully editable. With a projected year-one revenue of $610,000 and a 3-month window to break-even, this model provides a practical framework for your investment.
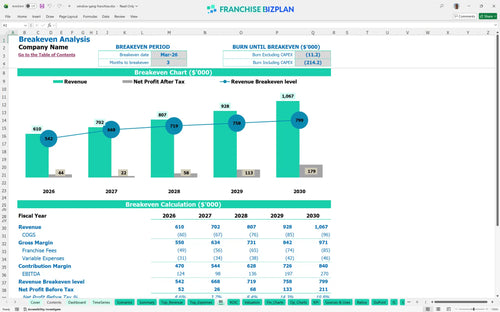
Based on the data, this unit hits its break-even date in March 2026, just three months after launch. While year one shows a healthy $124,000 EBITDA, the real scale happens by year five as revenue climbs to $1,067,000. Profitability depends on managing the 8% combined royalty and marketing burden while keeping fuel costs around 3.8% of sales.
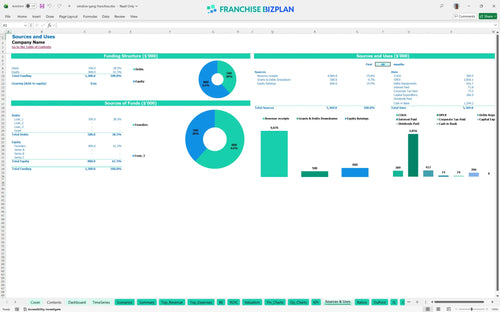
You will need approximately $266,000 to launch this unit in the US market. This covers the $65,000 initial fee and a significant $110,000 investment in branded service vehicles. The startup budget template for small service franchise also accounts for $28,000 in cleaning equipment and $18,000 for the office fitout to ensure professional operations from day one.
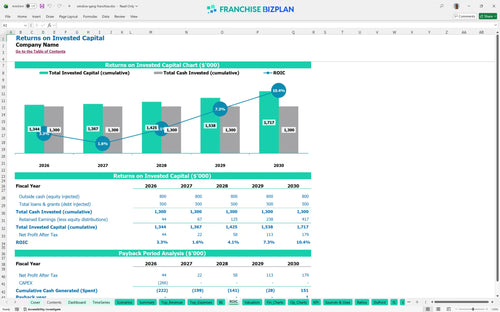
The model shows an Internal Rate of Return (IRR) of 3.1% and a Return on Equity (ROE) of 0.52. With a 5-year payback period, this is a long-term play focused on building equity through a service franchise recurring revenue model. By year five, the $270,000 annual EBITDA represents a strong return on the initial $266,000 cash outlay.
Monthly fixed costs sit at roughly $7,200, driven largely by the $3,200 warehouse rent and $1,900 fleet insurance. To cover these plus the 8% royalty and 10% COGS, you need to generate significant volume in window and solar panel cleaning. Reaching break-even in month 3 is aggressive and requires immediate local marketing execution to fill the schedule.
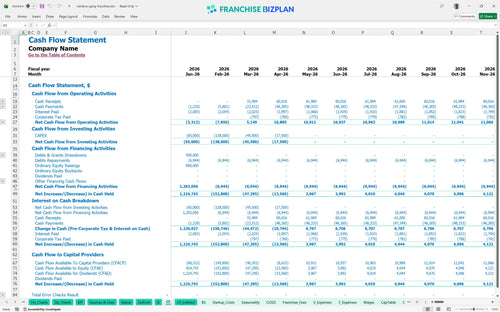
The lowest cash point occurs in April 2026, shortly after launch. While the JSON indicates a high minimum cash position of $1,011,000, your actual operational runway depends on how quickly you ramp up the five technicians planned for the first year. If revenue lags, the $13,200 monthly payroll for the GM and Sales Coordinator becomes a heavy lift.
Moving from a medium to a high scenario significantly alters your capital expenditure planning and hiring needs. In a high-growth case, you might need to accelerate the purchase of additional vehicles beyond the initial $110,000. Conversely, a low scenario where revenue misses the $610,000 year-one target would defintely squeeze the 20% EBITDA margin and delay the 5-year payback.
This franchise financial model template is a flexible Excel tool designed for real-world operators. You can swap out the pre-filled assumptions for your specific territory or labor market to see how different variables impact your bottom line. It handles the heavy lifting of math so you can focus on the strategy of the service franchise business plan.

Mapping out five years of performance helps you see past the initial scramble of opening. This model tracks revenue forecasting from $610,000 in year one up to over $1 million by year five. It provides a clear view of how store-level EBITDA evolves as you scale your fleet and technician count over time.

Royalties and brand funds are non-negotiable costs of doing business. This model calculates the 6% franchise royalty fees and 2% marketing fund contributions automatically based on your sales volume. Knowing these numbers upfront ensures you understand the true cost structure for residential service franchises before signing the agreement.

Getting a service business off the ground requires more than just a truck. This franchise investment calculator totals your $266,000 in initial capital, covering everything from the $65,000 franchise fee to $110,000 for branded vehicles. Use the break-even analysis for new franchise owners to see exactly when your monthly revenue covers your fixed overhead.

Don't guess on your operating expenses. The model includes benchmarks for labor and supplies, like the 8% COGS (cost of goods sold) for chemicals and disposables. Comparing your projections against these standards helps in evaluating franchise investment feasibility and spotting potential margin leaks early in your operations.


Simply purchase and download the financial model template, then access it instantly using Microsoft Excel or Google Sheets. No installation or technical expertise required-just open and start working.

Enter your business-specific numbers, including revenue projections, costs, and investment details. The pre-built formulas will automatically calculate financial insights, saving you time and effort.

Leverage the investor-ready format to confidently showcase your financial projections to banks, franchise representatives, or investors. Impress stakeholders with clear, data-driven insights and professional reports.

Leverage the investor-ready format to confidently present your projections to banks, franchise representatives, or investors.