
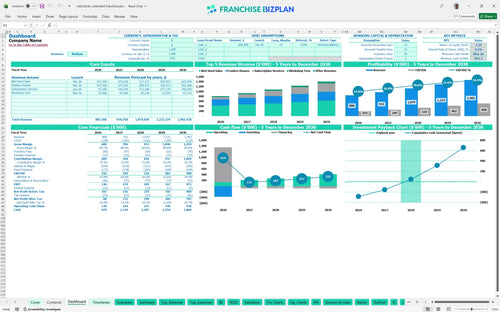
All-in-one Dashboard
Core inputs and core outputs


This template provides a complete roadmap for a niche retail franchise, covering everything from seed subscription revenue to specialized bird specialist payroll.
Core inputs and core outputs
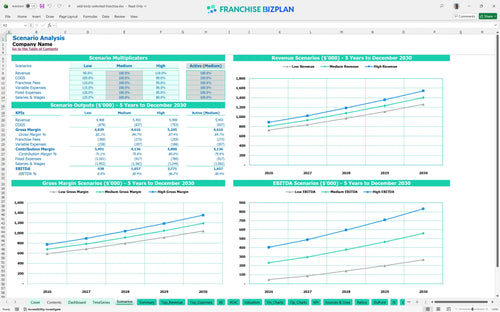
Three scenario analysis
Presentation ready
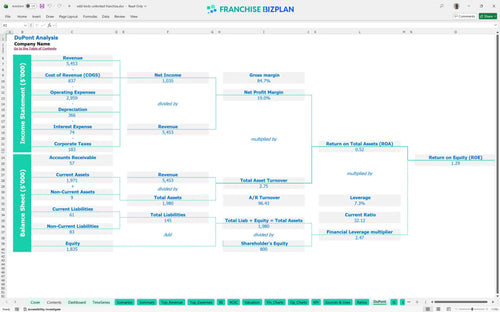
DuPont analysis
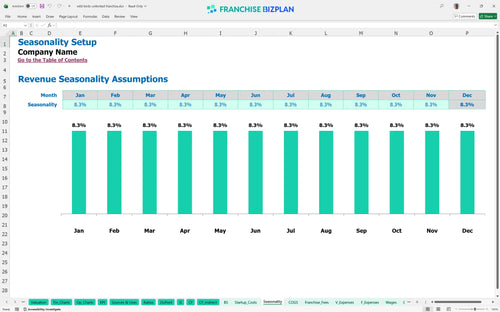
Researched revenue assumptions
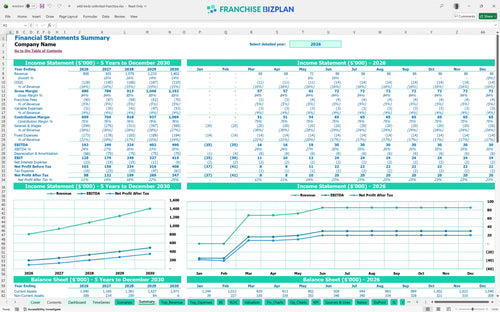
Lender-friendly financial outputs
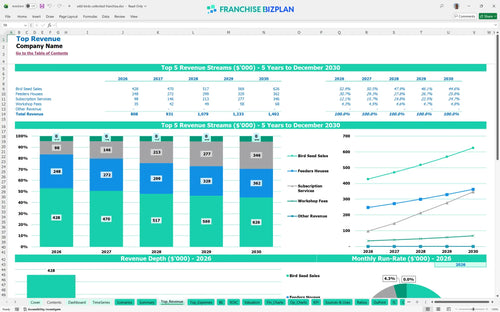
Revenue stream detailed view
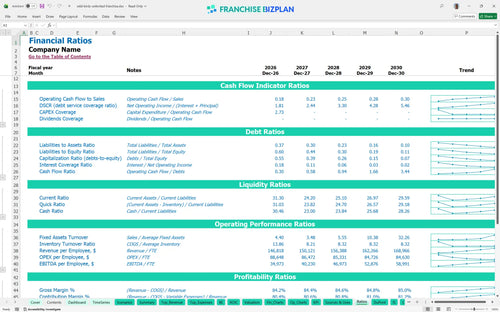
Performance metrics benchmark
We built this franchise unit financial model using our own research into the specialty backyard nature retail sector. Key assumptions, including seed sales, $10,500 monthly rent, and tiered staffing for certified bird specialists, are pre-populated and fully editable. This model helps you visualize how a $808,000 year-one revenue target translates into a $192,000 EBITDA while managing a 4% royalty burden.
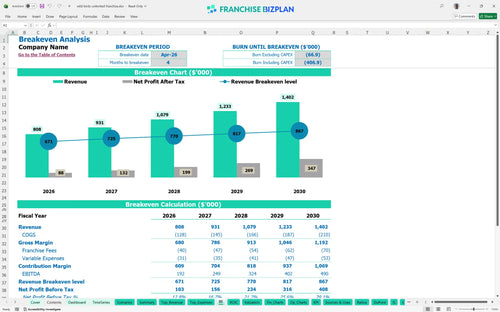
You can expect to hit your monthly break-even point by April 2026, just four months after launching. With year-one EBITDA projected at $192,000, the unit moves into the black quickly because of high-margin seed sales and recurring subscription income. Still, you will need to watch those 14% product purchase costs to keep margins healthy as you scale toward $1.4 million in annual sales.
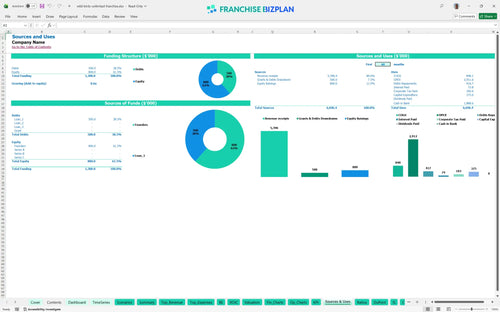
Launching this unit requires a significant upfront investment, primarily driven by $180,000 for leasehold improvements and the $40,000 franchise fee. Your total startup capital allocation must also cover $45,000 for shelving displays and $45,000 for initial inventory to stock the floor. Honestly, having a solid cash buffer is vital, as the model shows a minimum cash need of $851,000 during the ramp-up phase in early 2026.
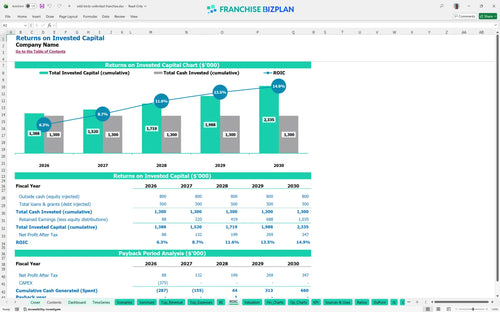
The return on investment metrics for this niche retail franchise show a 3-year payback period and an internal rate of return (IRR) of 4.53%. While the IRR might look conservative, the return on equity (ROE) of 1.29 reflects a stable, cash-flowing asset once the unit matures. By year five, you are looking at nearly $500,000 in annual EBITDA, which defintely makes the initial $180,000 build-out worth the effort.
Your monthly break-even happens in April 2026, assuming you hit your early revenue targets for bird seed and feeders. The biggest hurdle to reaching this point is the $10,500 monthly rent for a prime retail location, which acts as a heavy fixed cost. To stay safe, you need to maintain a high average ticket (the average amount a customer spends) through expert consultative selling and workshop fees.
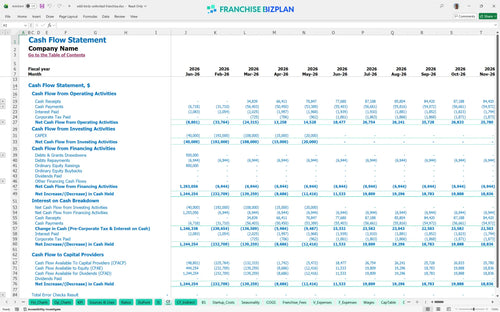
The model identifies May 2026 as your lowest cash point, with a minimum requirement of $851,000 to stay liquid. This includes your operating losses during the first few months and the heavy initial CAPEX like the $20,000 for delivery equipment. If your leasehold improvements take 60 days longer than planned, your working capital pressure will rise, so keep a tight lid on pre-opening spending.
Moving from a medium to a high-growth scenario can drastically change your year-one margin and peak cash needs. If bird seed sales grow faster than the projected 10% annual rate, your EBITDA will climb well above the $192,000 year-one estimate. Plus, the high scenario assumes better labor productivity from your retail associates, which helps offset the 4% royalty burden and keeps the business lean.
This franchise unit financial model lives in Excel, giving you total control over every line item from bird seed margins to seasonal staffing. You can swap out the pre-loaded rent for your specific local market rates or adjust the subscription delivery growth to see how it hits your bottom line. It is built for the 'what-if' moments, like if your leasehold improvements (renovations) run 10% over budget. Every formula is open, so you can see exactly how your inputs drive the final valuation.

Successful multi-unit operators look past the grand opening to see where the cash flows in year three and beyond. This model projects revenue climbing from $808,000 in year one to over $1.4 million by year five, helping you plan for future equipment upgrades or territory expansion. By tracking EBITDA (earnings before interest, taxes, depreciation, and amortization) over 60 months, you can spot when your niche retail store finally starts paying you back for that initial hustle. Long-term planning is the only way to manage a retail franchise business plan effectively.

Royalties and brand funds are the franchise tax that never goes away, so you need to model them with precision. This tool calculates the 4% royalty and 1% marketing fee against your gross sales, showing exactly how much goes to the franchisor every month. It also accounts for the $40,000 initial franchise fee, ensuring your startup capital allocation (how you spend your initial cash) is realistic from day one. Understanding these fixed percentages helps you protect your store-level margin during slower months.

Opening a retail store involves more than just a lease; you have to fund $180,000 in leasehold improvements and $45,000 in initial inventory before the first customer walks in. This franchise startup cost calculator identifies your total investment and the exact sales volume needed to cover your $10,500 monthly rent. Knowing your break-even point helps you manage the early months when traffic is still building and cash is tight. Plus, it maps out your CAPEX (capital expenditures) like the $12,000 POS system and $18,000 signage.

Don't guess if your 14% product purchase cost is good; use the built-in benchmarks to see how you stack up against other niche retail units. The model includes typical ranges for labor costs and occupancy (rent) to ensure your unit economic modeling (the math of a single store) stays grounded in reality. If your retail associates' payroll exceeds the 2.5 FTE (full-time equivalent) starting point, the model flags the impact on your store-level margin. It is a sanity check for your franchise unit financial projection.


Simply purchase and download the financial model template, then access it instantly using Microsoft Excel or Google Sheets. No installation or technical expertise required-just open and start working.

Enter your business-specific numbers, including revenue projections, costs, and investment details. The pre-built formulas will automatically calculate financial insights, saving you time and effort.

Leverage the investor-ready format to confidently showcase your financial projections to banks, franchise representatives, or investors. Impress stakeholders with clear, data-driven insights and professional reports.

Leverage the investor-ready format to confidently present your projections to banks, franchise representatives, or investors.