
All-in-one Dashboard
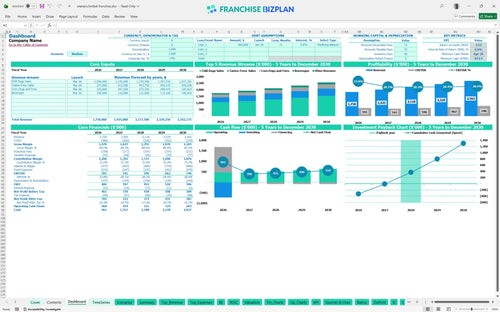
Core inputs and core outputs


This template provides a complete franchise unit profitability analysis spreadsheet including automated income statements, cash flow tracking, and detailed capital expenditure budget schedules.
Core inputs and core outputs
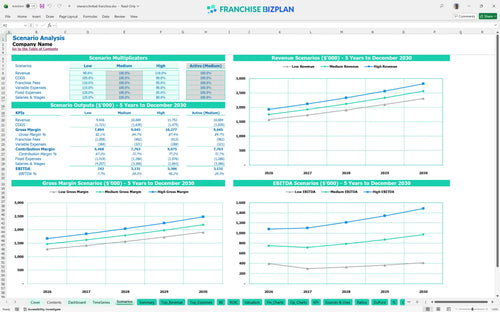
Three scenario analysis
Presentation ready
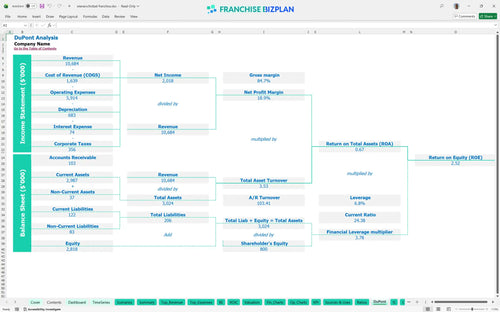
DuPont analysis
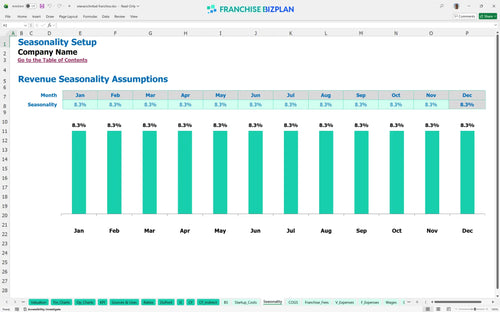
Researched revenue assumptions
Lender-friendly financial outputs
Revenue stream detailed view
Performance metrics benchmark
We built this franchise unit financial model using our own research into the quick-service hot dog and dessert sector. Key assumptions, including the $1.75M year-one revenue and the 9% total brand fees, are pre-populated with researched data and are fully editable. This tool provides a practical look at how to calculate franchise startup costs and manage a high-volume unit effectively.
Based on the data, this unit hits its stride quickly, reaching break-even by March 2026, just three months after launch. With Year 1 EBITDA projected at $591,000, the model shows a healthy margin even after accounting for the 5% royalty and 4% marketing fees. Here is the quick math: high volume and low food costs (14.5%) are the primary engines of this fast food restaurant financial model Excel template. Profitability depends on maintaining that throughput during peak hours.
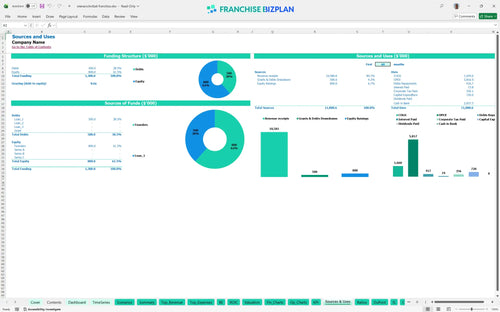
You will need roughly $720,000 to get the doors open, with the largest chunk going toward $300,000 in leasehold improvements. The model also accounts for $120,000 in kitchen gear and $90,000 for drive-thru infrastructure to handle the high volume. This capital expenditure budget covers everything from the initial fee to the final signage. Still, you should keep an eye on the $813,000 minimum cash point to ensure you have enough runway. Building a brand-standard facility is the biggest upfront hurdle.
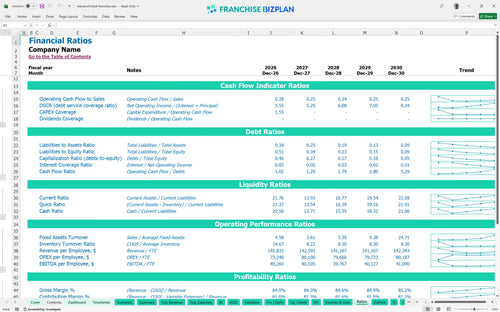
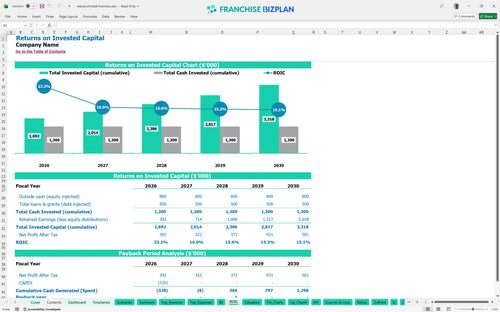
The model projects an Internal Rate of Return (IRR) of 6.57% and a full payback on your initial capital within 3 years. While the IRR seems modest, the steady cash flow and 2.52 ROE suggest a stable long-term play for a multi-unit operator. Calculating return on investment for franchise units requires looking past the first year to the $740,000 EBITDA potential in year five. What this estimate hides is the potential for even higher returns if you can beat the 14.5% food cost benchmark. It is a marathon, not a sprint.
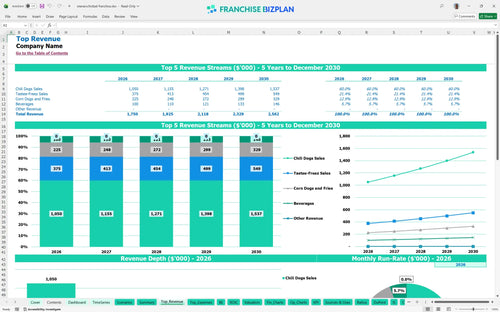
You reach the monthly break-even point in March 2026, needing to cover about $20,000 in monthly fixed costs like the $14,000 rent. The biggest lever here is volume; with chili dog sales making up $700,000 of year-one revenue, throughput is everything. This quick service restaurant unit economics analysis shows that every extra car in the drive-thru directly impacts your timeline to profitability. If labor costs spike, that break-even point will defintely slide further out. Efficiency at the window is your best friend.
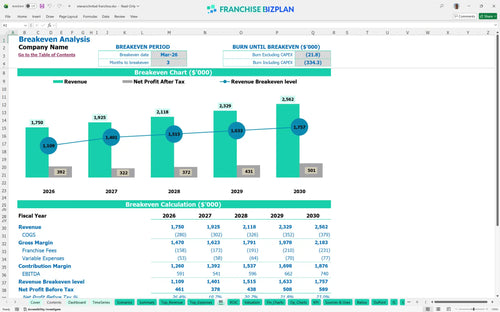
The lowest cash point hits in April 2026 at $813,000, so you need a solid cushion before the unit starts generating surplus. Since the model shows a 3-month ramp-up to break-even, having that working capital ready is critical to surviving the pre-opening phase. This franchise investment financial planning tool assumes you are fully staffed from day one, which puts immediate pressure on your cash reserves. Managing your opening inventory and vendor terms can help protect that initial pile of cash. Cash is oxygen during the first 90 days.
Moving from a medium to a high scenario could push Year 1 revenue well past the $1.75M mark, significantly shortening that 3-year payback. Low-case scenarios usually struggle with the $14,000 fixed rent, making local marketing execution the difference between a 6% IRR and a loss. These sample franchise pro forma financial statements show that even a 5% dip in traffic can tighten margins quickly due to the high fixed-cost structure. Your ability to drive repeat traffic through the loyalty program is the real game-changer. Execution is the only thing that separates a plan from a profit.
This franchise unit financial model lives in Excel, so you can tweak every variable from menu prices to local labor rates. It comes with pre-filled formulas and editable assumptions, making it easy to swap out the San Antonio rent for your specific zip code. This restaurant business plan spreadsheet ensures you aren't stuck with a static document when local costs shift. Plus, the logic is open, so you can see how every calculation flows from the dashboard to the final statement. Every location is different, and this tool respects that reality.

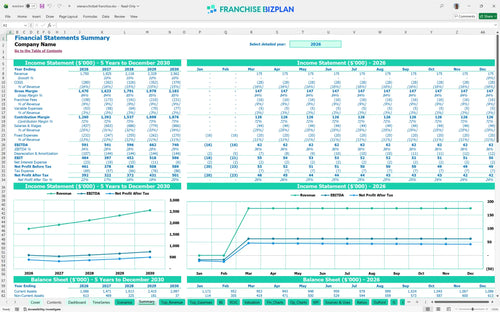
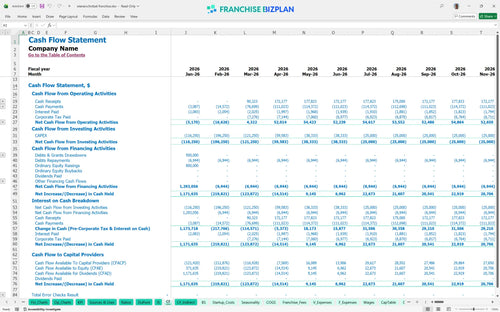
We mapped out a five-year trajectory where revenue climbs from $1.75 million in year one to over $2.5 million by year five. This quick service restaurant financial projections tool tracks how scaling traffic impacts your bottom line and cash flow over the long haul. It provides a clear view of the balance sheet and long-term profitability, helping you plan for future equipment upgrades or territory expansion. Honestly, a one-year view is never enough when you are signing a ten-year lease. You need to see the mountain before you start climbing it.

Operating under a major brand means paying for the privilege, and this model bakes in the 5% royalty and 4% marketing fund contributions automatically. It calculates these franchise royalty fee modeling costs against your monthly gross so you see exactly what is left for your pocket. We also included the initial $40,000 franchise fee in the year-zero startup costs to keep the math honest. Tracking these ongoing obligations is the only way to understand your true store-level margin. Don't let the brand fees surprise your bank account.

Use the franchise startup cost calculator to map out the $720,000 initial investment, covering everything from the $300,000 leasehold improvements to the kitchen gear. Knowing your break-even point calculation helps you manage the stress of those first few months of operation by showing exactly how many chili dogs you need to sell. The model separates fixed costs like the $14,000 monthly rent from variable costs like food ingredients. This clarity helps you identify the sales volume required to stop burning cash. Knowing your floor is just as important as knowing your ceiling.

We included industry standards for labor and food costs so you can see if your 14.5% ingredient margin is realistic or too optimistic. This franchise unit economics template helps you compare your expected performance against typical quick-service ranges to avoid common blind spots. If your projected labor is way lower than the industry average, the model will highlight that gap before you commit capital. It is essentially a sanity check for your business plan. Use these benchmarks to keep your expectations grounded in real-world data.


Simply purchase and download the financial model template, then access it instantly using Microsoft Excel or Google Sheets. No installation or technical expertise required-just open and start working.

Enter your business-specific numbers, including revenue projections, costs, and investment details. The pre-built formulas will automatically calculate financial insights, saving you time and effort.

Leverage the investor-ready format to confidently showcase your financial projections to banks, franchise representatives, or investors. Impress stakeholders with clear, data-driven insights and professional reports.

Leverage the investor-ready format to confidently present your projections to banks, franchise representatives, or investors.