


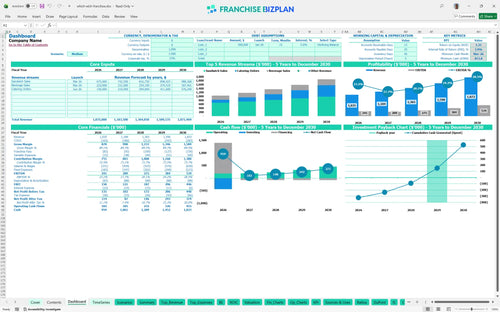
All-in-one Dashboard
Core inputs and core outputs



This comprehensive tool includes dynamic revenue drivers, detailed CAPEX scheduling, and automated three-statement financial integration for a single franchise location.
Core inputs and core outputs
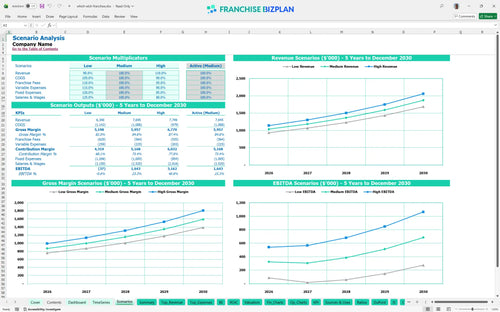
Three scenario analysis
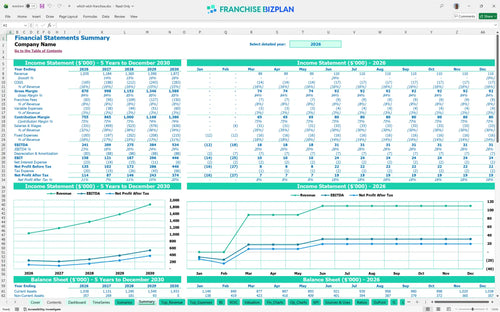
Presentation ready
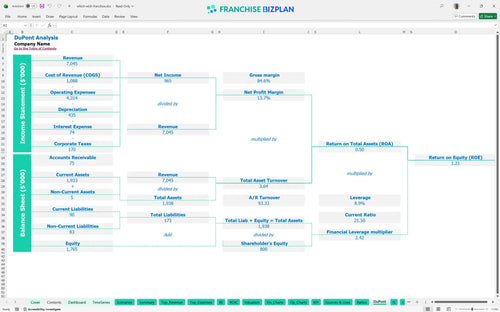
DuPont analysis
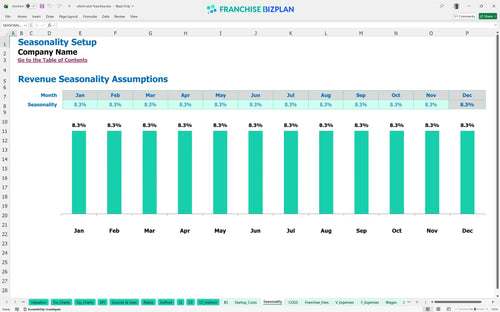
Researched revenue assumptions
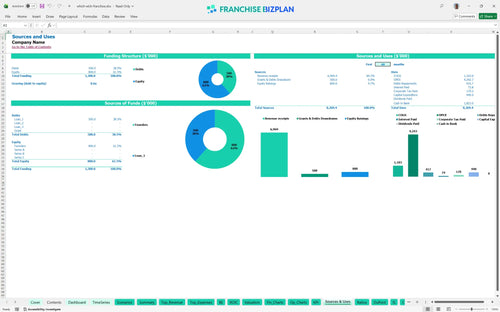
Lender-friendly financial outputs
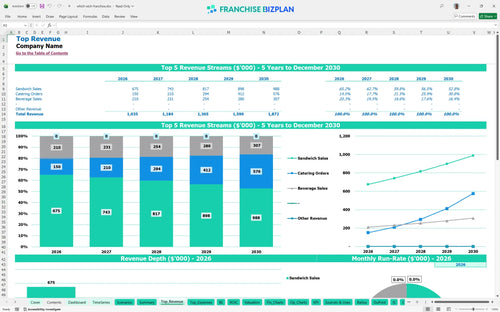
Revenue stream detailed view
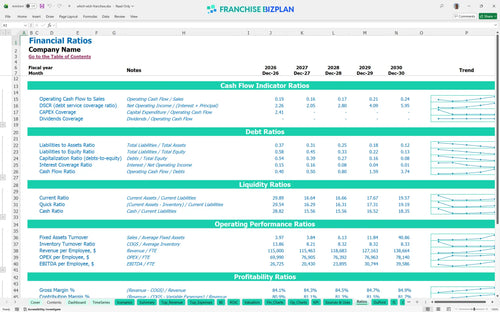
Performance metrics benchmark
We built this franchise unit financial model using our own research into the sandwich sector to provide a realistic starting point for your planning. Key assumptions, including the $1,035,000 first-year revenue and $241,000 EBITDA, are pre-populated with researched data and remain fully editable for your specific territory. This tool provides the restaurant franchise financial projections you need to move from a concept to a concrete plan.
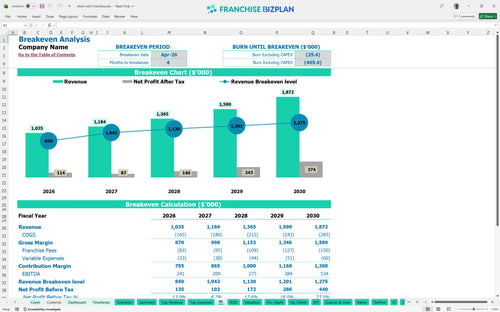
You can expect this unit to reach its monthly break-even point by April 2026, which is just 4 months after the initial launch phase. This franchise unit profit and loss template shows that profitability is driven by scaling sandwich sales and beverage attachments while keeping food ingredients at the projected 14% of revenue. Speed to profit defines your early stress levels.
To launch this unit, you need to understand how to calculate startup costs for a sandwich franchise, which total approximately $440,000 in hard costs plus working capital. Your startup capital requirements include a $30,000 franchise fee and $220,000 for leasehold improvements to meet brand standards. Knowing where every dollar goes prevents budget creep.
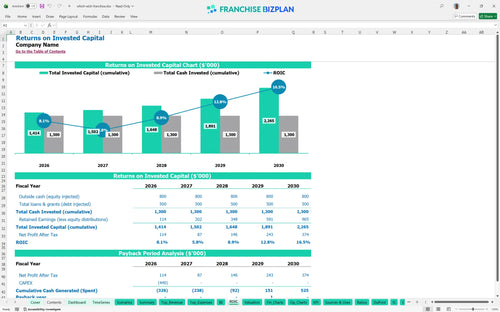
When calculating return on investment for franchise unit, this model shows an internal rate of return (IRR) of 3.92% and a 4-year payback period. The return on equity is 1.21, with EBITDA projected to grow from $241,000 in the first year to $534,000 by the end of year five. ROI is the ultimate scorecard for your investment.
This Excel template for franchise profit and loss statement identifies that you hit break-even in month 4 of operations. The primary driver for this is managing the $10,000 monthly rent and the $225,000 annual management and kitchen lead salaries against daily foot traffic. High rent requires high volume to survive.
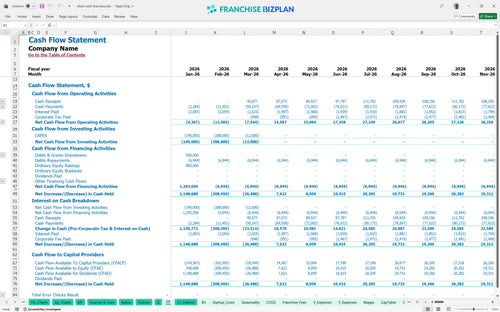
The lowest cash point occurs in March 2026, where the minimum cash balance is projected at $814,000 after accounting for all startup outflows. Using this cash flow projection template for small franchise, you defintely need to ensure your initial funding covers the ramp-up period before catering revenue kicks in. Cash is the lifeblood of your new shop.
These franchise unit financial forecasting tools allow you to compare how different sales volumes impact your year-1 margin and peak cash needs. In a high-performance scenario, increasing catering orders from $100,000 to $384,160 over five years significantly improves your long-term cash position. Planning for the worst helps you achieve the best.
Finance: update unit break-even and payback model by Friday
This franchise financial model template is built in Excel with fully editable assumptions, allowing you to swap out variables as your local market conditions change. You can adjust everything from sandwich pricing to hourly wages, and the pre-filled formulas will instantly update your projections to reflect the new reality. Every 1-point margin leak matters fast in a single-unit model.

Success in the quick-service industry requires looking beyond the grand opening to understand long-term cash flow and sustainability. This franchise business plan excel provides a detailed 5-year outlook, mapping out how revenue and expenses evolve as your store matures and gains local density. Long-term success depends on consistent traffic growth.

Operating under a major brand means accounting for specific franchise royalty fees and marketing fund contributions that come right off the top. This model automatically calculates these 6% royalty and 2% brand fund obligations based on your gross sales, ensuring you see the true net profit available for debt service or owner draws. Royalties are a top-line tax you must plan for.

Calculating your sandwich shop startup costs accurately is the difference between a smooth launch and an early cash crunch. We include a detailed break-even analysis for restaurants that identifies the exact monthly sales volume needed to cover your $10,000 rent and labor costs. Break-even is the first major milestone for any owner.

This model uses real-world franchise unit economics to help you sanity-check your operating expenses breakdown against industry standards. By comparing your projected food costs and labor percentages to established benchmarks, you can identify where your store might be overspending before the doors even open. Benchmarks keep your assumptions grounded in reality.


Simply purchase and download the financial model template, then access it instantly using Microsoft Excel or Google Sheets. No installation or technical expertise required-just open and start working.

Enter your business-specific numbers, including revenue projections, costs, and investment details. The pre-built formulas will automatically calculate financial insights, saving you time and effort.

Leverage the investor-ready format to confidently showcase your financial projections to banks, franchise representatives, or investors. Impress stakeholders with clear, data-driven insights and professional reports.

Leverage the investor-ready format to confidently present your projections to banks, franchise representatives, or investors.