
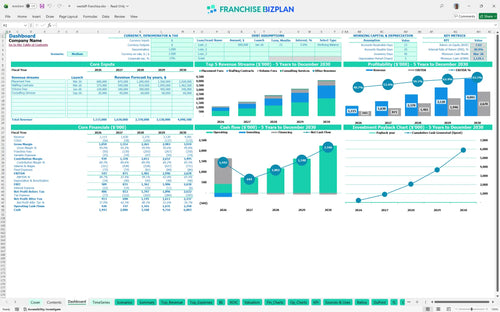
All-in-one Dashboard
Core inputs and core outputs


This staffing agency business plan excel includes everything from CAPEX scheduling to multi-year EBITDA projections for a single-unit operation.
Core inputs and core outputs
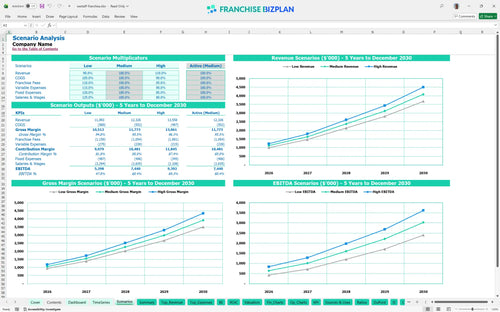
Three scenario analysis
Presentation ready
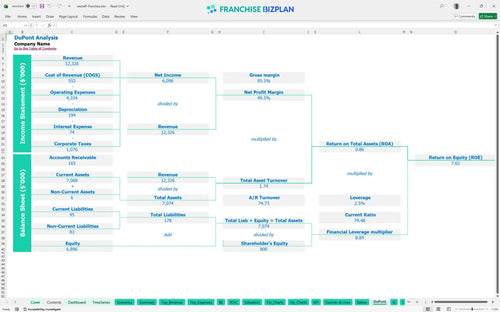
DuPont analysis
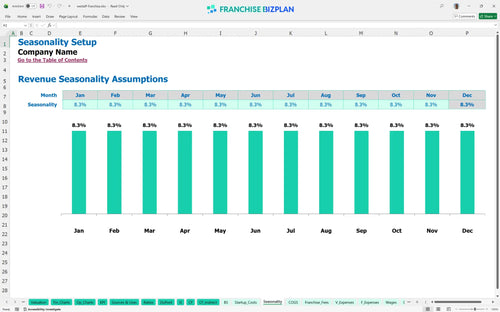
Researched revenue assumptions
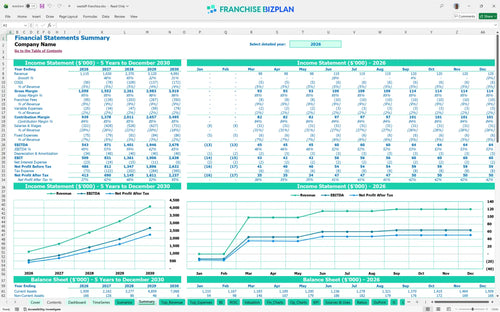
Lender-friendly financial outputs
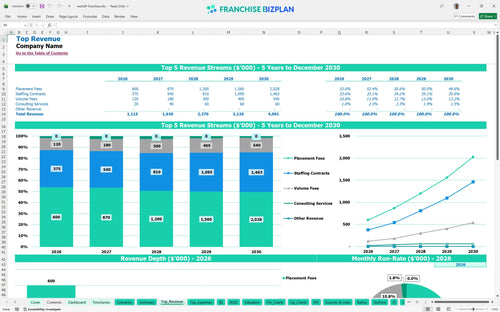
Revenue stream detailed view
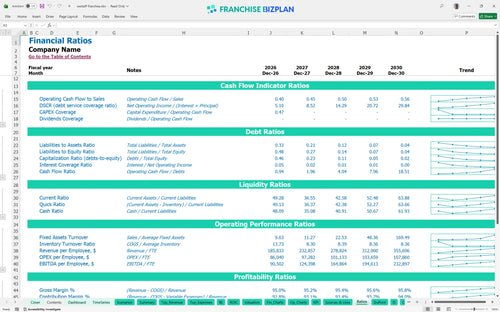
Performance metrics benchmark
We developed this model using detailed research on the light industrial staffing sector to ensure accuracy for new operators. Key inputs like the $39,950 initial fee and the 7.55% royalty rate are pre-loaded but defintely adjustable to your specific market conditions. With a Year 1 EBITDA of $543,000, the model provides a realistic baseline for evaluating this investment.
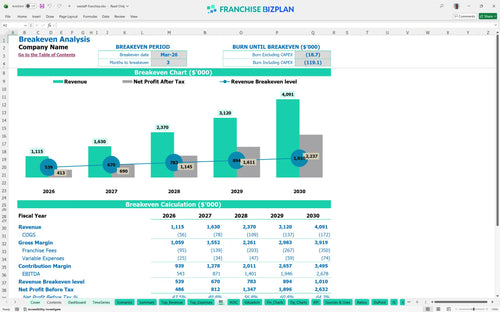
Profitability arrives quickly in this model, with a break-even date of March 2026, just three months after launch. By Year 2, EBITDA hits $871,000 as placement fees and staffing contracts scale alongside a growing recruiter team while evaluating profitability of a recruitment franchise unit.
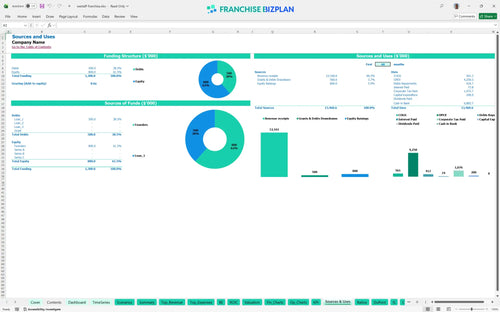
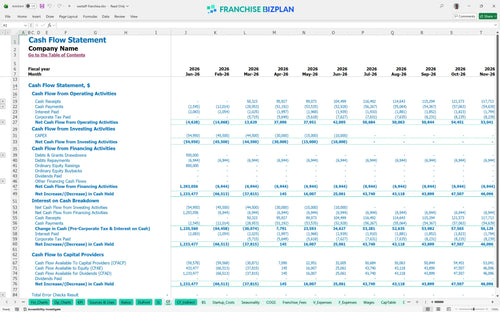
You need a significant cash position, with the model showing a minimum cash requirement of $1,129,000 by March 2026. This startup budget worksheet for staffing businesses covers the $39,950 franchise fee, $60,000 in office improvements, and $25,000 for IT equipment to handle high-volume recruitment.
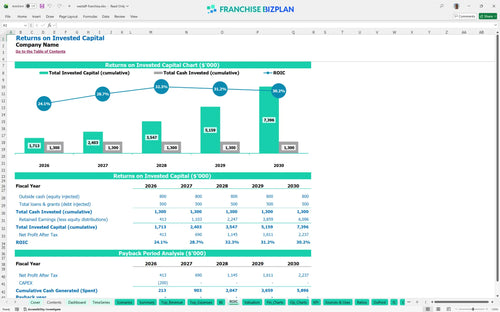
The staffing franchise investment calculator shows an Internal Rate of Return (IRR) of 20.94% and a Return on Equity (ROE) of 7.62%. While determining ROI for light industrial staffing franchise units, note that full payback occurs after Year 5 due to the high initial cash buffer required for franchise investment analysis for staffing agencies.
Break-even occurs in Month 3, requiring enough revenue to cover $4,200 in rent and roughly $23,000 in monthly base salaries. This is the best financial model for new staffing franchise owners to see how placement fees must offset the 8.55% combined royalty and marketing burden.
The lowest cash point hits in March 2026 at $1,129,000, suggesting you need substantial working capital to survive the ramp-up. Use this tool to learn how to forecast staffing agency revenue and expenses to ensure your cash buffer survives the first year of operations.
In the High scenario, increasing placement volume and reducing candidate vetting costs to 2.8% can drive Year 5 EBITDA well past $2.6 million. This franchise unit economic performance template shows how the Low scenario with slower sales ramp-up would extend the payback period significantly.
Finance: update unit break-even and payback model by Friday.
This staffing franchise financial model is built in Excel with open formulas, allowing you to swap out local rent or wage rates instantly. You can adjust the recruitment agency revenue model and use this excel template for franchise business planning to match your specific territory's demand for light industrial or administrative roles.

The staffing agency franchise financial projections template scales from a Year 1 revenue of $1,115,000 to over $4,091,000 by Year 5, reflecting a maturing client base. It tracks the shift from initial placement fees to long-term managed staffing contracts, providing a clear view of franchise financial forecasting and franchise profitability analysis.

Managing franchise royalty fees is critical, as the 7.55% royalty and 1.0% marketing fee are calculated off gross sales. This tool ensures you see the impact of these costs on your bottom line before you sign a lease or hire your first recruiter.

Use the franchise startup cost template to map out the $39,950 franchise fee and $60,000 in office improvements. It identifies how to calculate startup costs for a staffing franchise and the exact volume needed to cover the $4,200 monthly rent and $80,000 manager salary.

The model incorporates built-in benchmarks for staffing business operational costs, such as candidate vetting (starting at 3.2%) and recruitment advertising. These allow you to compare your unit's efficiency against standard franchise unit performance metrics in the light industrial sector.


Simply purchase and download the financial model template, then access it instantly using Microsoft Excel or Google Sheets. No installation or technical expertise required-just open and start working.

Enter your business-specific numbers, including revenue projections, costs, and investment details. The pre-built formulas will automatically calculate financial insights, saving you time and effort.

Leverage the investor-ready format to confidently showcase your financial projections to banks, franchise representatives, or investors. Impress stakeholders with clear, data-driven insights and professional reports.

Leverage the investor-ready format to confidently present your projections to banks, franchise representatives, or investors.