
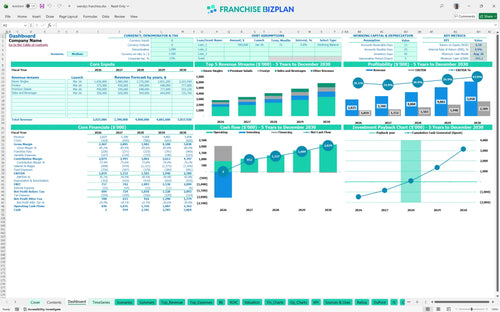
All-in-one Dashboard
Core inputs and core outputs


This automated financial model for franchise operations provides a complete toolkit including CAPEX schedules, 5-year P&L statements, and detailed payroll calculators for a flagship QSR unit.
Core inputs and core outputs
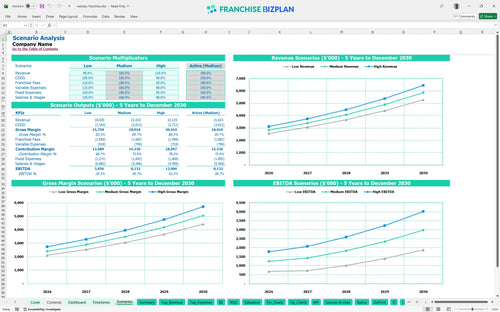
Three scenario analysis
Presentation ready
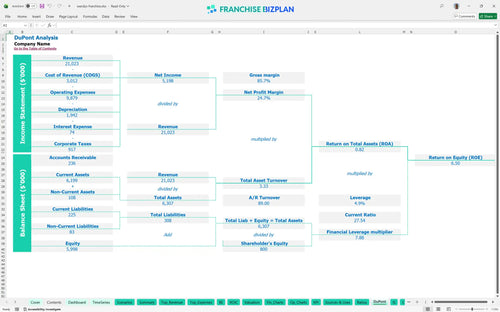
DuPont analysis
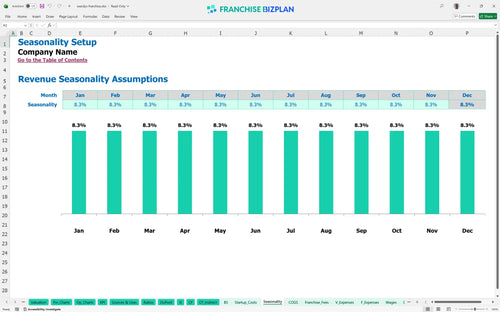
Researched revenue assumptions
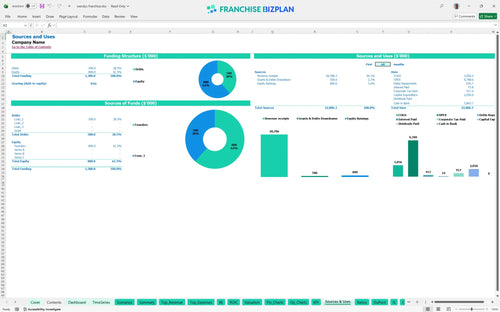
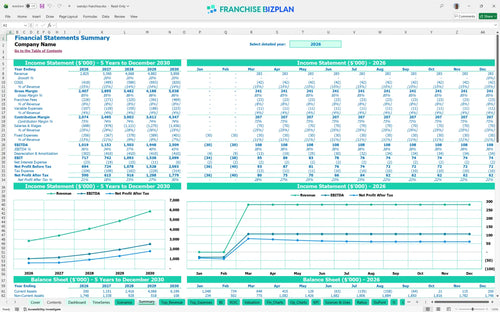
Lender-friendly financial outputs
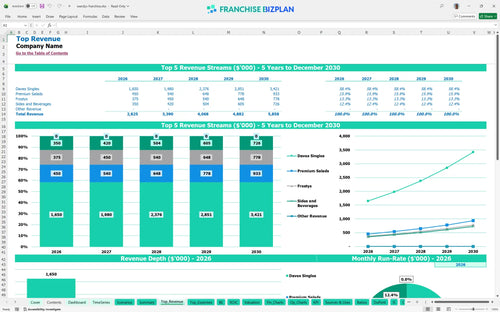
Revenue stream detailed view
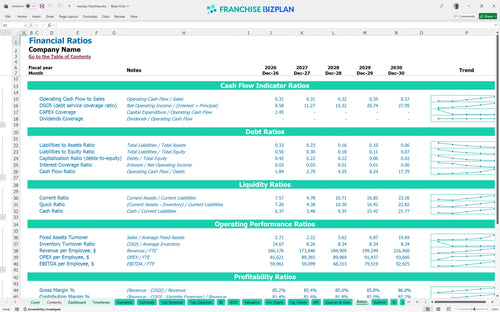
Performance metrics benchmark
We developed this model through deep research into QSR unit economics to help you navigate the Austin urban hub. The pre-populated data covers everything from $450,000 in kitchen equipment to specific revenue streams like Dave's Singles and Frostys, all while keeping the $2.8M year-one revenue target in clear focus.
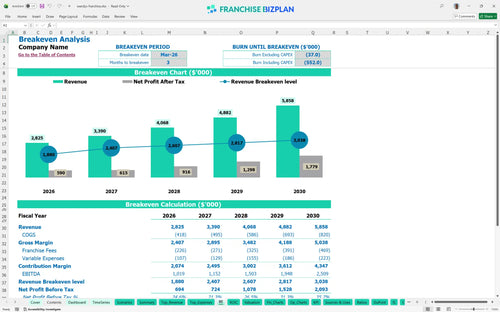
The unit hits its break-even date in March 2026, just three months after the doors open. By year one, you are looking at an EBITDA of $1,019,000, which scales significantly as you refine your unit economics and manage food costs at the 12.2% to 13% range.
Launching this unit requires a total capital expenditure of $2,050,000 to cover the flagship build-out and technology stack. This includes the initial $50,000 franchise fee and a significant $900,000 investment in leasehold improvements to meet modern brand standards in high-density areas.
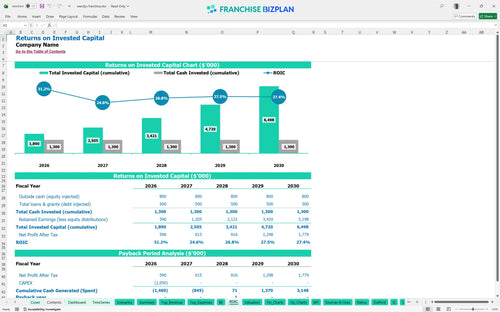
Calculating ROI for a new franchise location shows an IRR of 4.91% and a 3-year payback period on your initial investment. While the ROE is 6.5, the cash flow accelerates in years 4 and 5, with EBITDA eventually crossing the $2.5 million mark annually.
You need to clear the monthly break-even hurdle by month 3 to cover $30,700 in fixed monthly costs, including $20,000 for prime location rent. The primary driver for reaching this point is the high-volume throughput of the dual-lane drive-thru and mobile-order pickup portals.
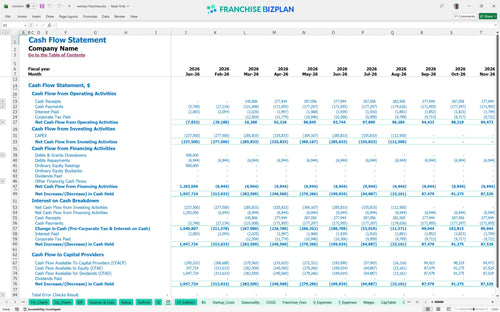
Your lowest cash point defintely occurs in August 2026 at -$355,000, requiring a disciplined approach to working capital during the ramp-up. Analyzing operating expenses for fast food franchises shows that managing the timing of leasehold payments and equipment draws is vital to surviving the first eight months.
Evaluating profitability of a flagship restaurant unit shows that a 10% swing in revenue significantly alters your peak cash need and year-1 margin. In a high-growth scenario, the 4% royalty and 4% marketing fees are easily absorbed, but a low-volume scenario makes the $20,000 monthly rent a heavy burden.
This franchise financial model is built entirely in Excel with open formulas and editable assumptions. You can quickly adjust the sales volume for signature burgers or change the crew member headcount to see how it impacts your bottom line in the Austin market.

Success in the QSR space requires looking past the first year of operations. This QSR business plan template maps out a 5-year growth path, showing revenue climbing from $2.82 million in year one to over $5.85 million as your local market density increases.

We built this to handle the specific financial obligations of a major QSR brand, including the 4% royalty and 4% marketing fund contributions. It ensures your franchise unit profitability analysis accounts for every dollar sent to the franchisor before you calculate your take-home pay.

Estimating startup costs for a quick service restaurant is simpler when you have a detailed breakdown of the $2.05 million initial investment. This model tracks everything from the $50,000 franchise fee to the $900,000 leasehold improvements, identifying the exact sales volume needed to cover your monthly $20,000 rent.

This fast food investment calculator includes researched benchmarks to help you sanity-check your operating margins. If your food costs for premium salads or sides vary from the 13% target, the model helps you identify where the margin leak is happening so you can fix it fast.


Simply purchase and download the financial model template, then access it instantly using Microsoft Excel or Google Sheets. No installation or technical expertise required-just open and start working.

Enter your business-specific numbers, including revenue projections, costs, and investment details. The pre-built formulas will automatically calculate financial insights, saving you time and effort.

Leverage the investor-ready format to confidently showcase your financial projections to banks, franchise representatives, or investors. Impress stakeholders with clear, data-driven insights and professional reports.

Leverage the investor-ready format to confidently present your projections to banks, franchise representatives, or investors.