
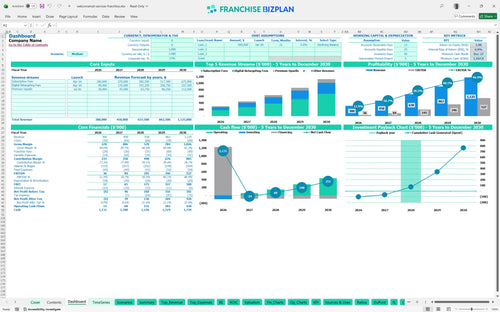
All-in-one Dashboard
Core inputs and core outputs


This comprehensive package includes a dynamic 5-year projection, a detailed startup cost calculator, and a recurring revenue tracker to manage your local marketing unit with CFO-level precision.
Core inputs and core outputs
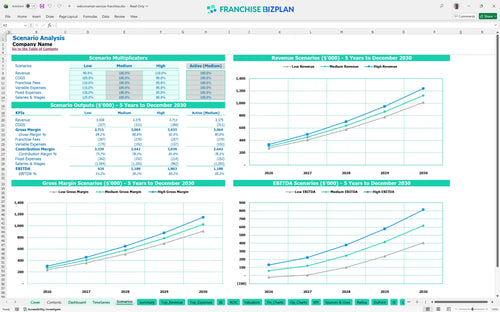
Three scenario analysis
Presentation ready
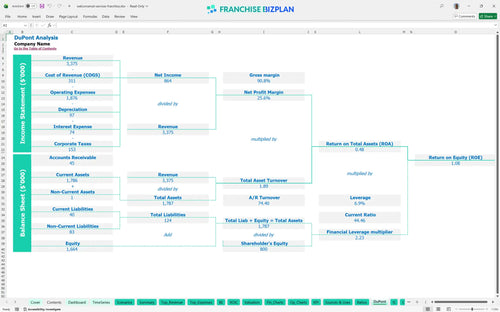
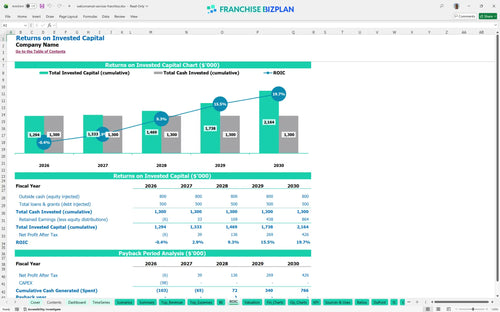
DuPont analysis
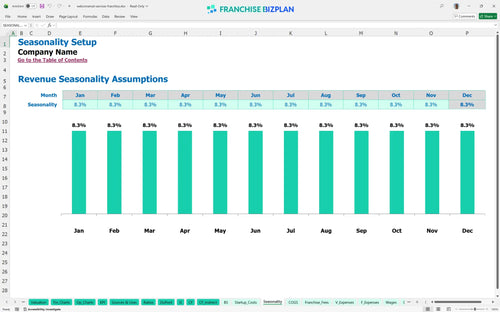
Researched revenue assumptions
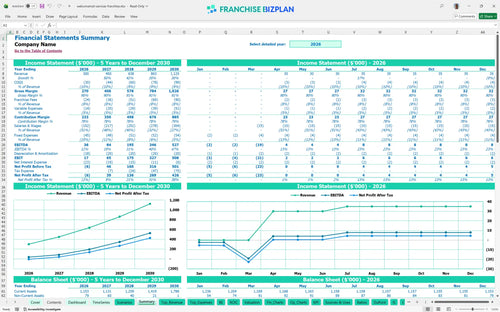
Lender-friendly financial outputs

Revenue stream detailed view
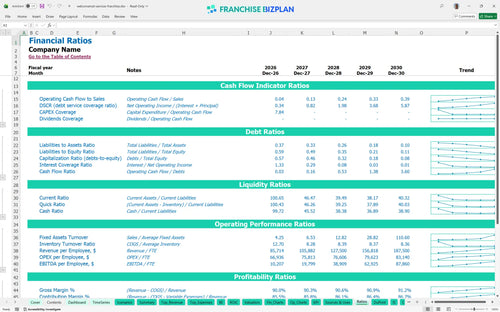
Performance metrics benchmark
We built this franchise unit financial model using our own research into the local marketing and mover-tracking sector. Key assumptions-including revenue streams like subscription fees, operating expenses, and the $47,000 initial fee-are pre-populated with researched data specific to this service unit and are fully editable to help you learn how to forecast revenue for a service-based franchise.
The unit reaches profitability in Year 1 with an EBITDA of $36,000, which scales to $527,000 by Year 5 as recurring revenue matures. By calculating net profit after the 6% royalty and 2% marketing fees, the model shows a clear path to positive earnings within the first twelve months of operation.
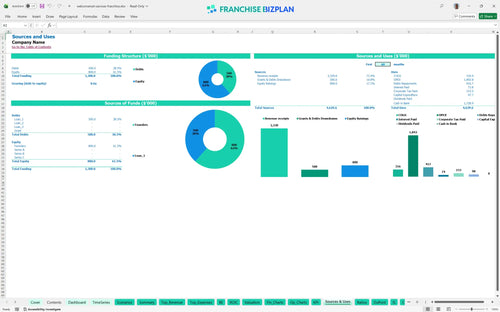
Launching this unit requires a total initial investment that covers the $47,000 franchise fee, $15,000 for a company vehicle, and $12,000 for office furniture. Knowing how to calculate startup costs for a new franchise is essential, as you must also account for $8,500 in technology setup and $5,000 in initial marketing materials to drive early lead generation.
Investors can expect an Internal Rate of Return (IRR) of 6.05% and a Return on Equity (ROE) of 1.08 over the five-year period. Calculating ROI for local marketing franchise units shows a payback period of 3 years, making this a stable long-term play for operators focused on franchise unit profitability metrics for investors.
The unit is projected to hit its monthly break-even point in May 2026, just 5 months after the initial launch. This rapid timeline depends on hitting subscription targets and estimating marketing costs for local franchise units accurately, as sales volume is the primary driver for covering fixed costs like the $1,800 monthly rent.
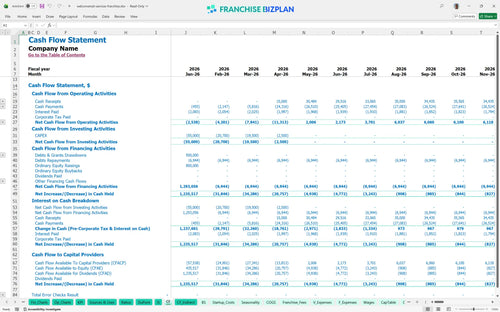
The lowest cash point is projected at $1,108,000 in December 2027, suggesting a significant need for working capital to support the ramp-up phase. Using a spreadsheet for franchise unit cash flow forecasting helps you monitor this runway and ensures you defintely have enough liquidity to handle the timing gaps between production costs and client payments.
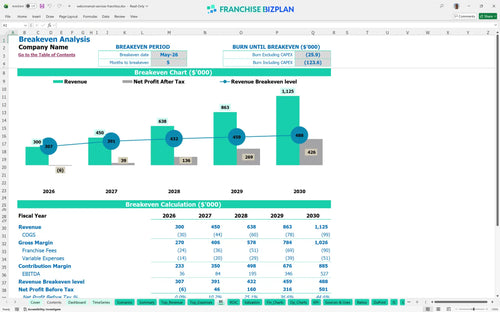
The High scenario sees revenue climbing to $1,125,000 by Year 5, significantly shortening the payback period and boosting the IRR. Conversely, a Low scenario with slower subscription growth could delay the breakeven date and increase the peak cash need, highlighting the importance of sales rep productivity and local market density.
This financial planning guide for new franchise locations serves as a robust franchise business plan template, consolidating your revenue forecasts and startup costs into a professional format. It provides the data-driven clarity needed to move from evaluation to execution, ensuring your local marketing unit is built on a solid financial foundation.
Finance: update unit break-even and payback model by Friday.
This franchise financial model template is a fully customizable Excel tool designed for precision and flexibility. It features pre-filled formulas and editable assumptions, allowing you to adapt the model to your specific territory, local labor rates, and unique operating scenarios. Whether you are adjusting for North Austin or a different high-growth corridor, this franchise financial model Excel template for small businesses ensures your numbers remain accurate and actionable.

Long-term success requires more than a one-year view; you need a franchise financial projection spreadsheet that maps out the next 60 months. This model provides a detailed 5-year outlook, showing revenue growing from $300,000 in Year 1 to $1,125,000 by Year 5. By performing a deep franchise unit profitability analysis, you can visualize how recurring subscription fees and digital retargeting scale over time to drive significant store-level margins.

Operating within a brand system means managing specific financial obligations that impact your bottom line. This model tracks the 6% royalty fee structure and the 2% brand marketing fund contribution, ensuring you see the real economics after these off-the-top costs. Analyzing franchise royalty and marketing fees early helps you maintain a healthy contribution margin while staying compliant with brand standards.

Launching a new unit requires a clear understanding of your total initial investment, including the $47,000 franchise fee and essential equipment. This franchise startup cost calculator helps you estimate the capital needed for office build-out, vehicle leases, and pre-opening marketing. By identifying your fixed and variable cost structure, the model determines the exact sales volume required to reach the break-even point and start generating positive cash flow.

Sanity-checking your numbers against industry standards is vital for a realistic unit economics model. This template incorporates benchmarks for franchise operating expenses, such as mailer production costs starting at 7.5% and labor allocations for sales representatives. Comparing your expected performance against these typical ranges helps you identify potential margin leaks and ensures your staffing plan aligns with service-based industry norms.


Simply purchase and download the financial model template, then access it instantly using Microsoft Excel or Google Sheets. No installation or technical expertise required-just open and start working.

Enter your business-specific numbers, including revenue projections, costs, and investment details. The pre-built formulas will automatically calculate financial insights, saving you time and effort.

Leverage the investor-ready format to confidently showcase your financial projections to banks, franchise representatives, or investors. Impress stakeholders with clear, data-driven insights and professional reports.

Leverage the investor-ready format to confidently present your projections to banks, franchise representatives, or investors.