
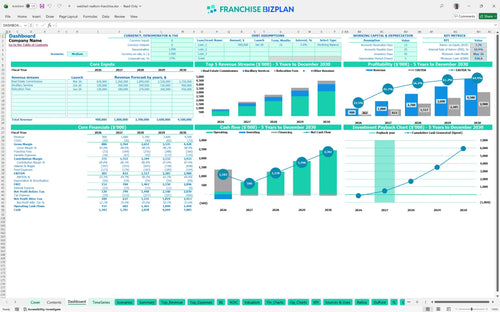
All-in-one Dashboard
Core inputs and core outputs


This real estate franchise financial model excel template includes detailed revenue drivers, staffing plans, and comprehensive 5-year financial statements for your brokerage.
Core inputs and core outputs
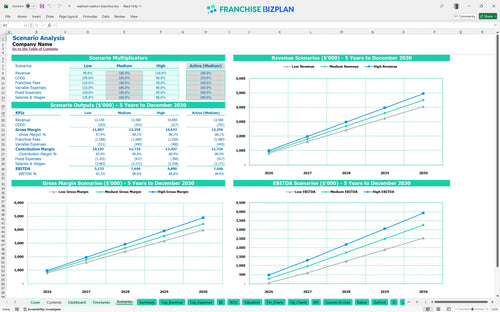
Three scenario analysis
Presentation ready
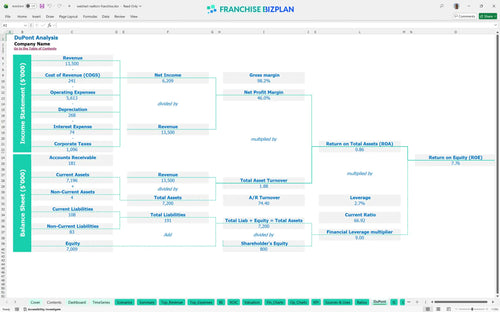
DuPont analysis
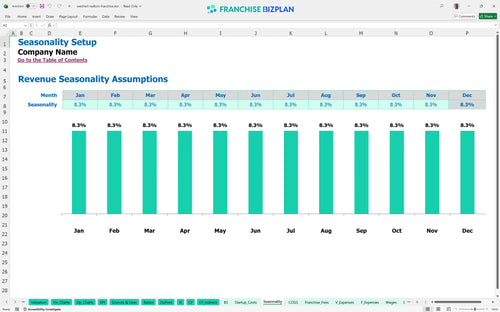
Researched revenue assumptions
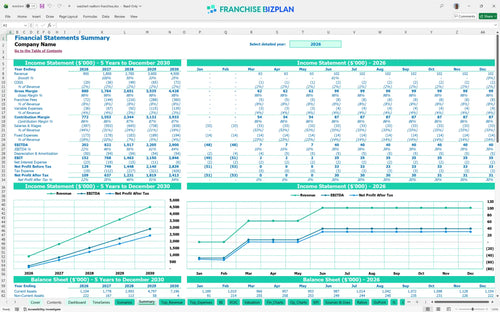
Lender-friendly financial outputs
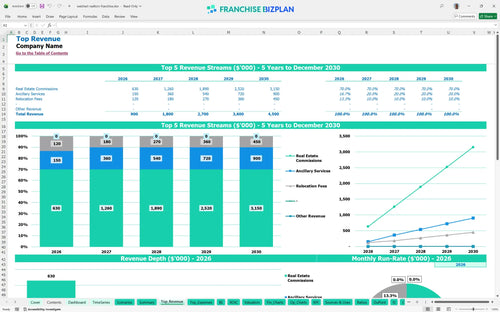
Revenue stream detailed view
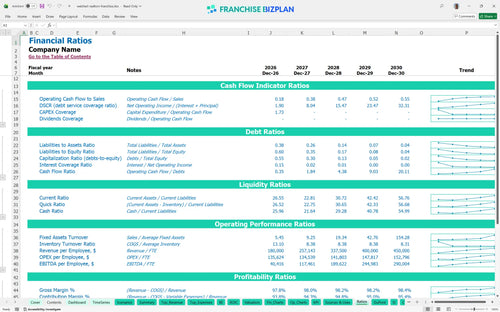
Performance metrics benchmark
We built this real estate franchise financial model using our own research into brokerage operations and commission revenue projections. Key assumptions like staffing, royalties, and marketing fund contributions are pre-populated and fully editable, showing a Year 1 EBITDA of $202,000. This financial planning guide for real estate franchise owners helps you navigate the ramp-up to a projected $4.5 million in revenue by year five.
This unit is projected to hit its break-even date in April 2026, just four months after launching. A profitability analysis for residential real estate brokerage shows EBITDA scaling from $202,000 in year one to over $2.9 million by year five as you add agents.
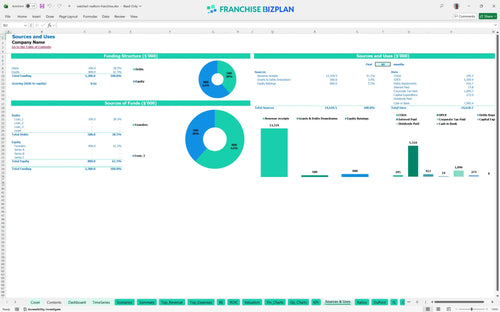
You will need a minimum cash balance of $921,000 by May 2026 to cover the initial ramp-up and capital expenditure planning. This includes the $25,000 franchise fee, $120,000 for office improvements, and $35,000 for furniture and fixtures when creating a budget for a new real estate franchise location.
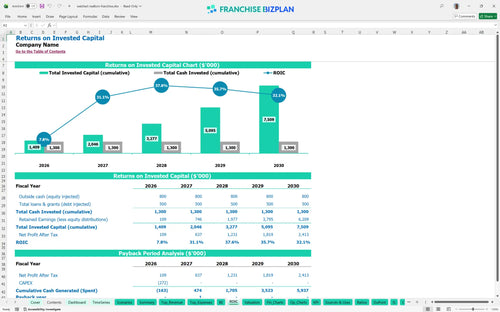
Investors can expect an Internal Rate of Return (IRR) of 10.94% and a Return on Equity (ROE) of 7.76%. With a two-year payback period, the model shows a defintely strong recovery of your initial capital if you hit the $1.8 million revenue mark in year two.
Reaching break-even takes about 4 months, requiring enough closed transactions to cover $10,000 in monthly rent and over $20,000 in fixed salaries. Break-even depends more on agent productivity than just headline sales volume, so focus on high-ticket listings early.
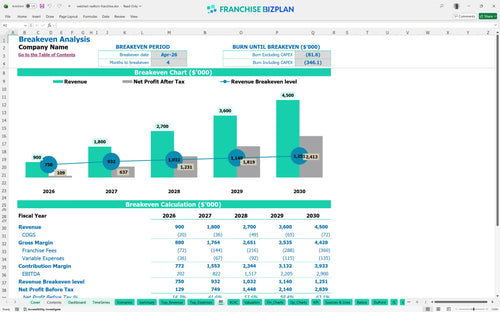
Your lowest cash point occurs in May 2026, so you need a solid buffer to survive the first five months of operation. If the real estate brokerage revenue model projection lags by even 60 days, you will need extra working capital to cover the $120,000 managing broker salary.
Moving from a medium to a high-growth scenario depends on scaling from 1.5 to 6.0 agents over five years. A franchise profitability analysis shows that a high-performing office can see EBITDA hit $2.9 million by year five, while a low-revenue case might delay payback beyond the two-year mark.
Finance: update unit break-even and payback model by Friday.
This real estate franchise financial model is fully customizable in Excel, featuring pre-filled formulas and editable assumptions that make it easy to adapt to your specific territory. You can use the Excel template for franchise business financial planning to adjust commission splits, agent headcount, or local rent to match your actual operating scenario.

Long-term planning is vital for a real estate brokerage financial projection, and this model provides a detailed 5-year view of your growth. It tracks your progress as you scale from $900,000 in year one to $4.5 million by year five, offering franchise unit financial forecasting for real estate offices that need to see the big picture.

The model captures your specific financial obligations, including the initial $25,000 fee and ongoing 6% royalty payments. Analyzing franchise royalty and marketing fees helps you understand the real economics of the brand before you commit to the territory.

Use this franchise startup cost calculator to estimate your total initial investment, including $120,000 for leasehold improvements and $35,000 for furniture. Knowing how to calculate startup costs for a real estate franchise helps you set realistic sales targets to cover your $10,000 monthly rent.

We've included built-in franchise unit economics benchmarks to help you sanity-check your operating expense forecasting. Estimating operating expenses for a new real estate franchise is simpler when you can compare your local costs against typical industry ranges for labor and occupancy.


Simply purchase and download the financial model template, then access it instantly using Microsoft Excel or Google Sheets. No installation or technical expertise required-just open and start working.

Enter your business-specific numbers, including revenue projections, costs, and investment details. The pre-built formulas will automatically calculate financial insights, saving you time and effort.

Leverage the investor-ready format to confidently showcase your financial projections to banks, franchise representatives, or investors. Impress stakeholders with clear, data-driven insights and professional reports.

Leverage the investor-ready format to confidently present your projections to banks, franchise representatives, or investors.