
All-in-one Dashboard
Core inputs and core outputs


This Excel financial model for new franchise unit provides a complete toolkit for analyzing recurring revenue streams for service franchises and calculating long-term investment viability.
Core inputs and core outputs
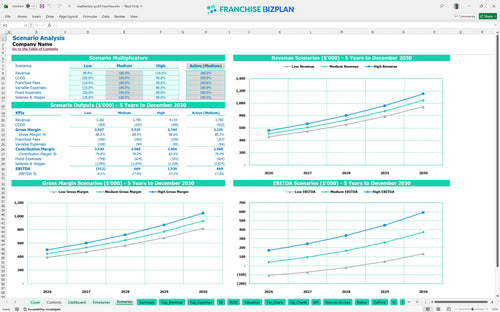
Three scenario analysis
Presentation ready
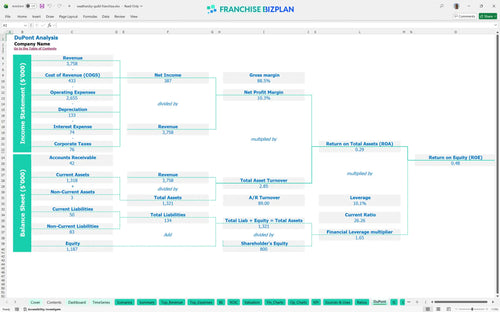
DuPont analysis
Researched revenue assumptions
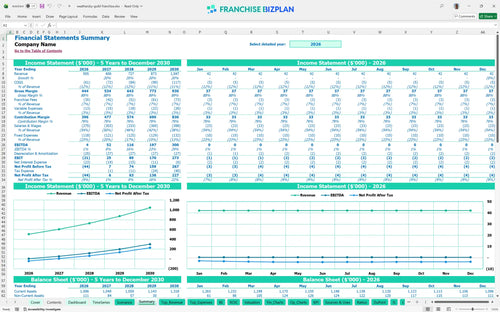
Lender-friendly financial outputs
Revenue stream detailed view
Performance metrics benchmark
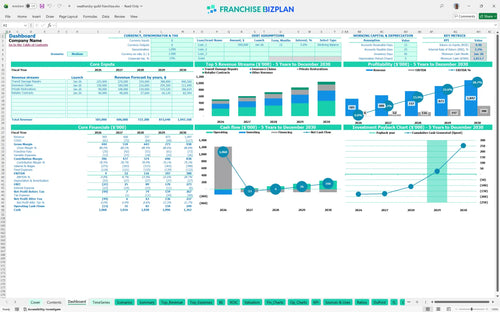
We built this franchise unit financial model using our own research to provide a realistic roadmap for your investment. Key assumptions, including the $505,000 year-one revenue target and the 7% royalty fee, are pre-populated and fully editable to fit your local market. This model helps you track the path from an initial $4,000 EBITDA to a mature $300,000 annual profit by year five.
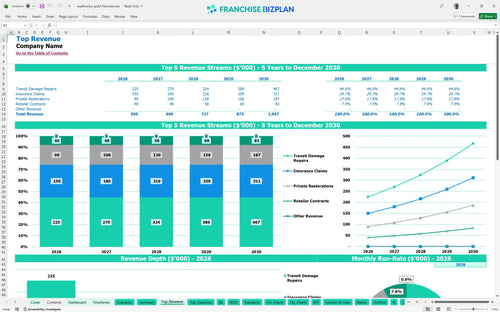
The unit shows a positive EBITDA of $4,000 in the first year, but true profitability accelerates as revenue climbs toward $1,047,000 by year five. Net profit is calculated after accounting for the 7% royalty and restoration materials that start at 10% of sales.
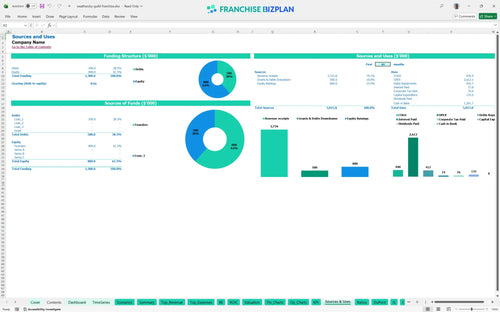
Launching this unit defintely requires a focused capital expenditure planning approach for the initial $130,000+ outlay. The total investment covers the $49,000 franchise fee, workshop fitout, and specialized restoration equipment needed to meet brand standards.
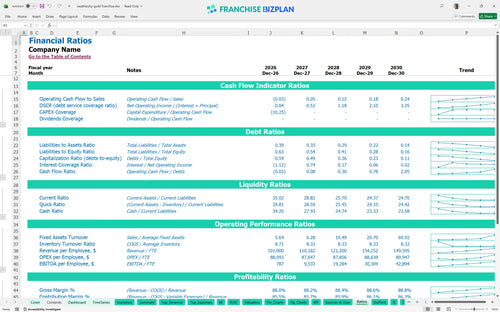
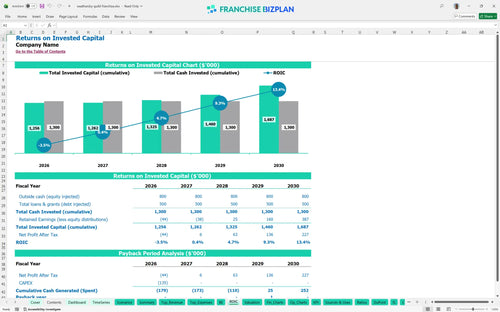
Franchisees can expect a return on investment calculation showing an IRR of 3.21% and a payback period of 4 years. This reflects a steady-state service business where the ROE of 0.48 is driven by specialized craftsmanship and recurring B2B contracts.
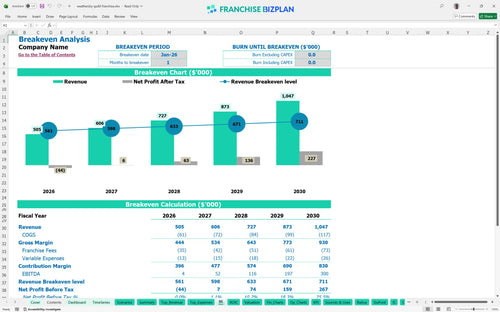
The model projects a break-even date in January 2026, which is just 1 month after launch if you hit your initial sales targets. The primary driver for break-even is managing the $6,000 monthly workshop lease and the $238,000 initial annual payroll burden.
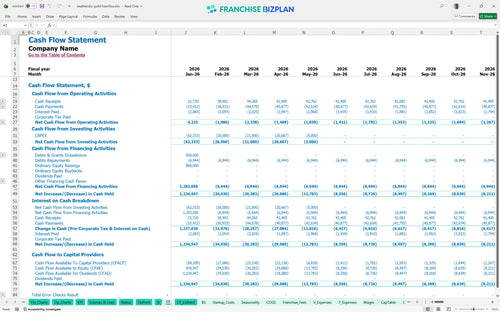
The lowest cash point is estimated at $1,014,000 in January 2028, reflecting the capital needed to scale the team to 4 junior craftsmen. You must defintely build a cash flow forecast for a franchise to manage the gap between job completion and insurance payouts.
A high-performance scenario focuses on hitting the $311,040 transit damage revenue target by year five, significantly boosting the $300,000 EBITDA. A low scenario might extend the payback period if restorationn contracts lag, making local marketing execution the deciding factor.
Finance: update unit break-even and payback model by Friday.
This franchise financial model template is built in Excel with a logic-driven structure that allows you to adjust every variable. You can modify pre-filled formulas and editable assumptions to match your specific territory, whether you are looking at a single unit or a multi-unit expansion. It is designed to be a flexible franchise startup cost calculator that adapts to your local market rent and labor rates.

Success in a service business requires looking past the first year of operations. This business financial projection template provides a detailed 5-year outlook on revenue, costs, and cash flow to help you understand the long-term unit economics model. It maps the transition from early-stage growth to a mature, high-volume restoration unit with stable margins.

Operating within a brand system means managing a specific franchise royalty fee structure. This model tracks the 7% royalty fee and the initial $49,000 investment to ensure your franchise unit profitability analysis is accurate. It helps you visualize how these top-line deductions impact your store-level EBITDA as you scale your service volume.

Knowing how to calculate startup costs for a service franchise is the first step toward a successful launch. This tool functions as a startup budget template for service-based franchise units, identifying the exact sales volume needed to cover your $6,000 monthly rent and specialized labor. It provides a clear view of your margin and contribution at various stages of the ramp-up.

We include built-in benchmarks to help with evaluating franchise investment risk and ROI. These metrics allow you to sanity-check your operational cost forecasting against industry standards for skilled trades. By comparing your expected labor and material costs to typical ranges, you can identify potential margin leaks before they happen.


Simply purchase and download the financial model template, then access it instantly using Microsoft Excel or Google Sheets. No installation or technical expertise required-just open and start working.

Enter your business-specific numbers, including revenue projections, costs, and investment details. The pre-built formulas will automatically calculate financial insights, saving you time and effort.

Leverage the investor-ready format to confidently showcase your financial projections to banks, franchise representatives, or investors. Impress stakeholders with clear, data-driven insights and professional reports.

Leverage the investor-ready format to confidently present your projections to banks, franchise representatives, or investors.