
All-in-one Dashboard
Core inputs and core outputs


This model provides a full suite of pro-forma statements, automated calculators, and scenario tools designed specifically for a water refill station business.
Core inputs and core outputs
Three scenario analysis
Presentation ready
DuPont analysis
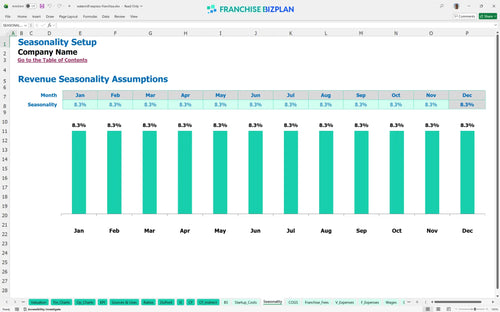
Researched revenue assumptions
Lender-friendly financial outputs
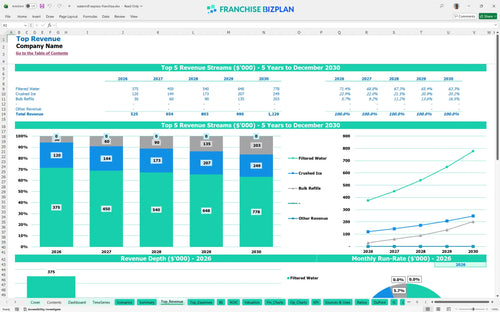
Revenue stream detailed view
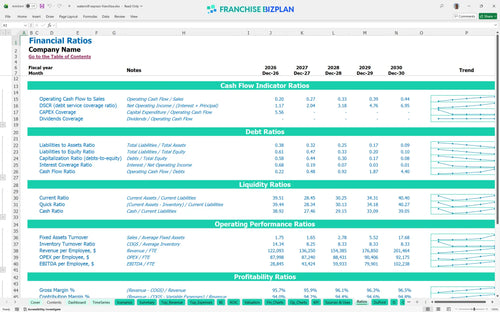
Performance metrics benchmark
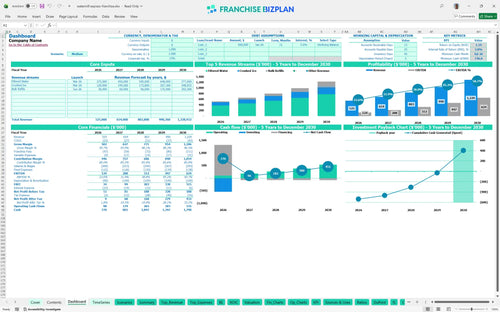
We built this franchise unit financial model using our own research to ensure your projections are grounded in reality. The pre-filled data shows Year 1 EBITDA starting at $124,000, assuming you hit your $525,000 revenue target across water and ice sales. All assumptions, from the $75,000 franchise fee to the 9% combined royalty and marketing burden, are fully editable to match your specific location.
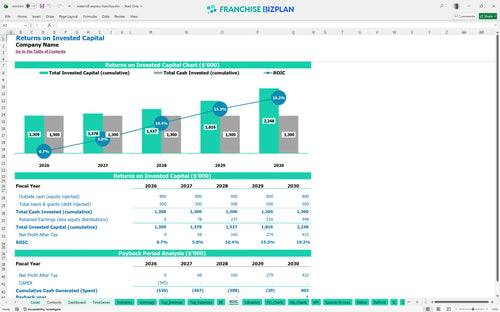
The unit reaches profitability in its first year, with EBITDA growing from $124,000 in Year 1 to $624,000 by Year 5. This growth is driven by a steady climb in revenue from $525,000 to over $1.2 million as you capture local demand. Here is the quick math: your net profit improves as you scale volume against fixed costs like the $5,000 monthly rent.
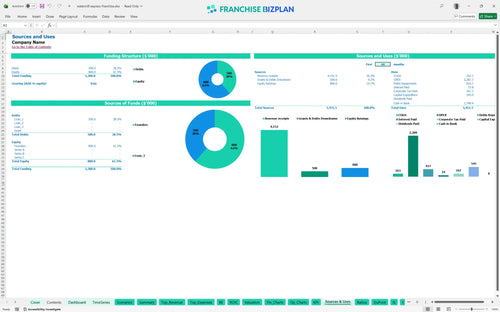
You need approximately $545,000 in total startup capital to launch this water kiosk franchise in the US. This covers the $75,000 franchise fee, $180,000 for filtration equipment, and $80,000 for site preparation. We also included a $20,000 contingency fund to handle any pre-opening cost overruns or construction delays. Still, you should keep a cash buffer for the first few months of operation.
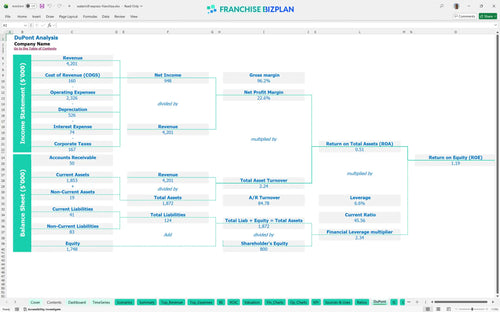
Investors can expect a 5-year payback period and an Internal Rate of Return (IRR) of 3% based on the researched cash flow projections. The Return on Equity (ROE) stands at 1.19, reflecting the steady nature of an automated vending business. While the IRR seems conservative, the store-level margin remains strong as revenue scales toward $1.2 million annually. What this estimate hides is the potential for higher returns through multi-unit supervision.
The unit hits its break-even point in April 2026, roughly 4 months after the initial launch. The primary driver for reaching this point is volume, as you must cover $10,200 in monthly fixed costs including rent, utilities, and maintenance. If opening takes 90+ days longer than planned, working capital pressure rises quickly. High-traffic site selection is the most critical factor for hitting these numbers early.
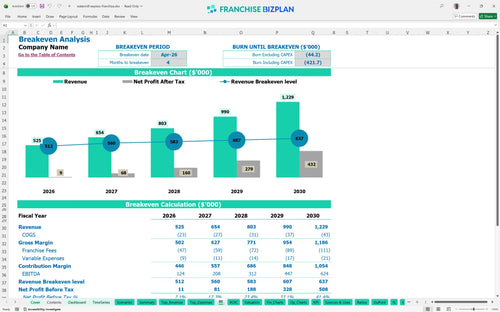
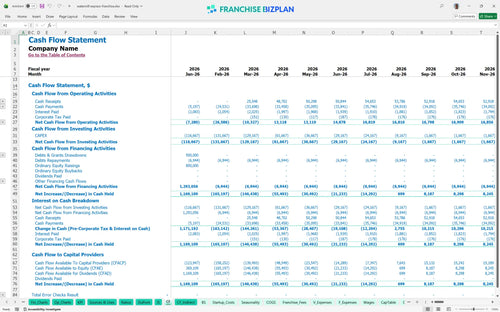
The lowest cash point occurs in July 2026, with a minimum cash balance of $736,000 required to sustain operations through the ramp-up. You need at least 4 months of runway to bridge the gap between opening and reaching a positive cash flow state. Honestly, having an extra cash buffer is recommended to protect against slow adoption in a new territory. Manage your opening inventory and staffing levels tightly during this window.
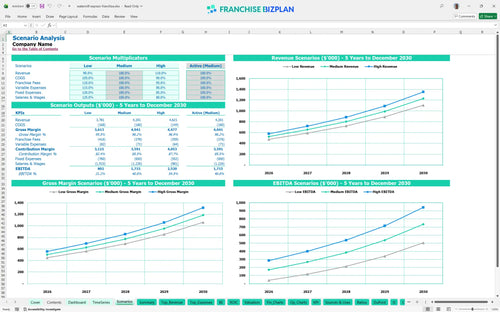
A high-growth scenario significantly improves your Year 1 margin by spreading the $175,000+ annual payroll over a larger revenue base. Conversely, the low scenario shows that if revenue stays near $525,000 for too long, the 5-year payback period could stretch further. Scenarios help you understand how a 10% shift in COGS or variable maintenance impacts your peak cash need. Execution in local marketing is what usually separates the high case from the low case.
This franchise financial model is fully customizable in Excel, allowing you to swap out pre-filled formulas to match your specific territory. You can easily adjust the $5,000 monthly rent or the $2,200 utility cost to see how site selection changes your bottom line. Every 1-point margin leak matters fast in a single-unit model, so having editable assumptions is vital for accuracy.

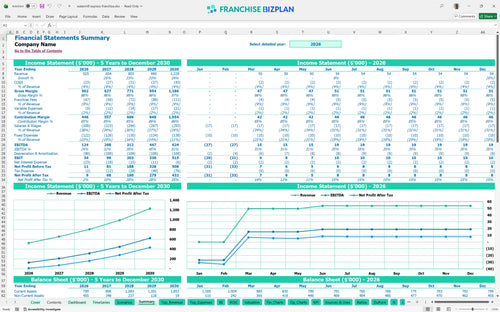
Scaling from $525,000 in year one to over $1.2 million by year five requires a clear roadmap for cash flow and reinvestment. This model tracks your trajectory, showing how EBITDA (earnings before interest, taxes, depreciation, and amortization) grows as you optimize throughput. It provides a long-term view of profitability so you can plan for multi-unit expansion or debt service. What this estimate hides is the timing gap between opening costs and mature performance.

Managing the 7% royalty and 2% marketing fee is critical for maintaining store-level margin in an automated vending franchise model. The tool automatically calculates these off your gross sales, including filtered water and crushed ice revenue, so you know exactly what is left for overhead. It captures all franchise-specific obligations to show the real economics of the unit. Plus, it keeps your brand fund contributions transparent for better budget planning.

This franchise investment calculator identifies your total entry cost, including the $75,000 franchise fee and $180,000 for filtration equipment. It pinpoints the exact month you stop burning cash, which is defintely the most important milestone for any new operator. Knowing your monthly cost structure helps you estimate the sales level required to cover fixed and variable costs. Break-even depends less on headline sales and more on local density and manager productivity.

Use built-in benchmarks to see if your 3.5% water source cost or your $65,000 general manager salary aligns with high-volume water dispensing business standards. It helps you spot margin leaks before you sign a lease or hire your first technician. Comparing your expected performance against typical ranges ensures your franchise unit budget planning excel template is grounded in reality. Sanity-checking your assumptions is the best way to avoid early operational surprises.


Simply purchase and download the financial model template, then access it instantly using Microsoft Excel or Google Sheets. No installation or technical expertise required-just open and start working.

Enter your business-specific numbers, including revenue projections, costs, and investment details. The pre-built formulas will automatically calculate financial insights, saving you time and effort.

Leverage the investor-ready format to confidently showcase your financial projections to banks, franchise representatives, or investors. Impress stakeholders with clear, data-driven insights and professional reports.

Leverage the investor-ready format to confidently present your projections to banks, franchise representatives, or investors.